See also


The market appeared to have bottomed out; however, someone knocked from below. A two-day selloff triggered by Donald Trump's sweeping tariffs turned out to be the fourth-worst in the history of the broad stock index since its inception in 1957. The 10.5% drop was only surpassed by the COVID-19 outbreak in 2020, the Lehman Brothers collapse in 2008, and Black Monday in 1987. This current plunge has wiped out $6.6 trillion in U.S. stock market capitalization — yet no one is rushing to buy the dip. It could still get worse.
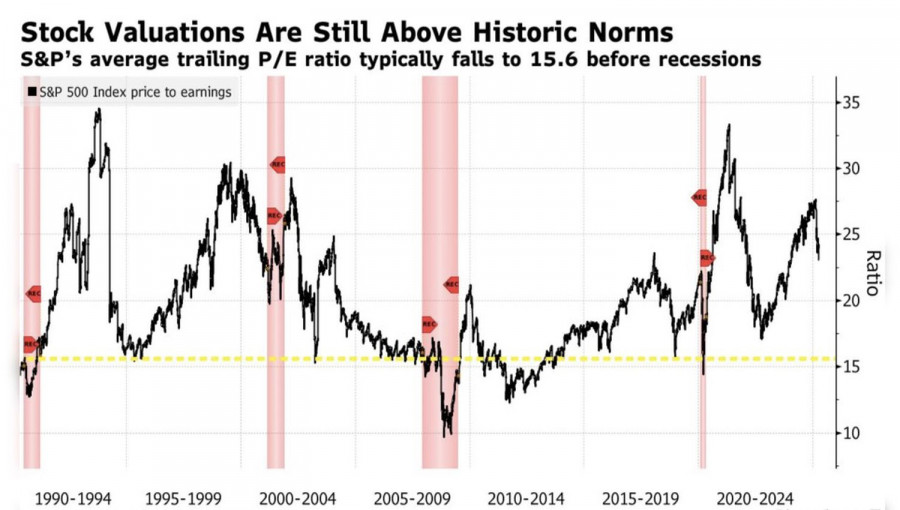
Historically, during recessions, the forward price-to-earnings ratio for the S&P 500 has averaged around 15.6. Despite the March selloff, this figure still sits at 23. The market has significant potential to decline further, preventing investors from attempting to "catch falling knives."
The bearish drivers haven't gone anywhere — in fact, Trump's massive tariffs have only intensified them. JPMorgan forecasts a 0.3% contraction in U.S. GDP for 2025, revising its previous estimate of +1.3% to a recession scenario. And even though Treasury Secretary Scott Bessent points to a strong labor market and claims no signs of an economic downturn, investors remain skeptical. While March employment figures were surprisingly strong, January and February data were revised downward, and unemployment rose. This may well be the calm before the storm.
China's retaliation — a 34% tariff on U.S. imports — fueled the fire. It once seemed that China would be forced to concede again, as it did in 2018–2019. But this time, the U.S. is against the entire world, not just one country. Washington may end up empty-handed, especially since Beijing has hinted at large-scale stimulus to soften the tariff blow. Europe is heading in the same direction, maintaining the attractiveness of equities in those regions and encouraging capital to shift away from North America.
And investors' behavior makes sense. Thanks to the strengthening dollar, Europeans have gained 490% on the S&P 500 over the past 15 years, while Americans earned just 390%. In contrast, European stock indices grew 220% in euros but only 150% in dollars. Pictet Asset Management is building its strategies based on the assumption that the USD index could decline by 10–15% over the next five years. So, is it surprising that capital flows eastward across the Atlantic?
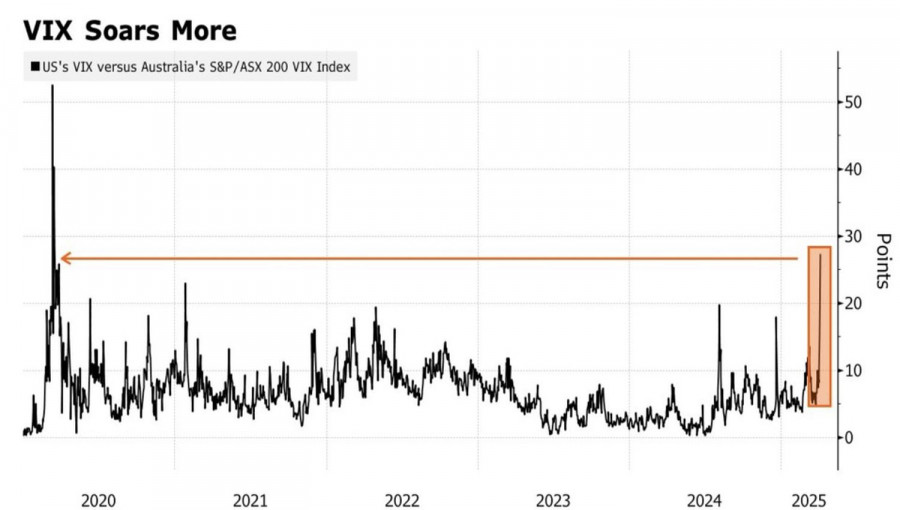
Moreover, the White House's tariffs appear to have hit U.S. equities harder than any other market. This is reflected in the VIX volatility index ratios, which have reached their highest levels since the pandemic.
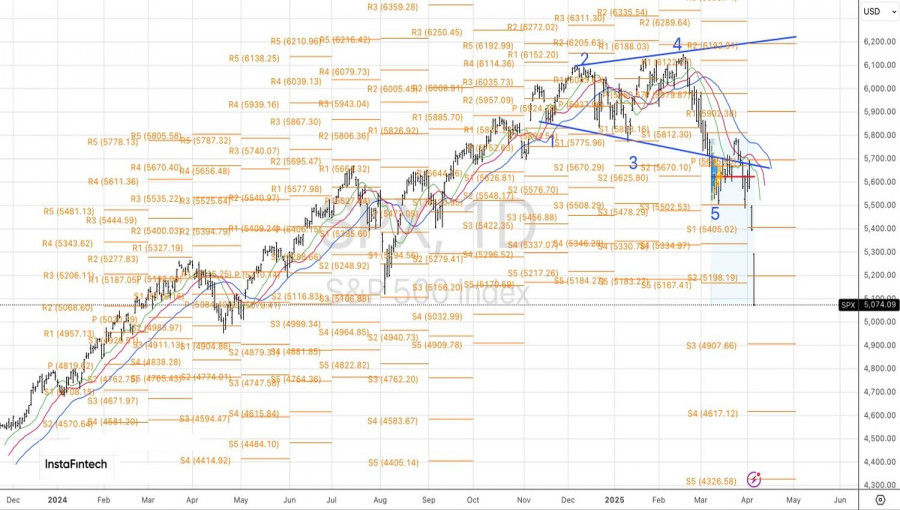
Technically, on the daily S&P 500 chart, the risk of further correction increases toward the pivot levels at 4910 and 4925. Previously opened short positions in the broad index should be held and periodically increased.
You have already liked this post today
*The market analysis posted here is meant to increase your awareness, but not to give instructions to make a trade.


Forex Chart
Web-version

Your IP address shows that you are currently located in the USA. If you are a resident of the United States, you are prohibited from using the services of InstaFintech Group including online trading, online transfers, deposit/withdrawal of funds, etc.
If you think you are seeing this message by mistake and your location is not the US, kindly proceed to the website. Otherwise, you must leave the website in order to comply with government restrictions.
Why does your IP address show your location as the USA?
Please confirm whether you are a US resident or not by clicking the relevant button below. If you choose the wrong option, being a US resident, you will not be able to open an account with InstaTrade anyway.
We are sorry for any inconvenience caused by this message.


