See also


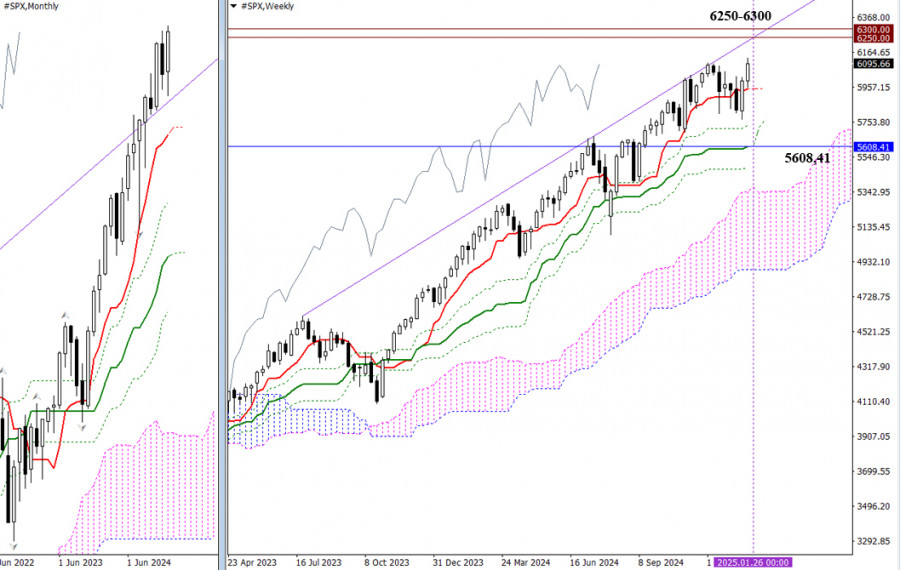
Last year, the index displayed an upward trend, correcting any bearish declines within one to two months at most. As a result, 2024 did not record a single bullish fractal, and record highs were continuously updated. By the end of the year, bearish forces attempted to slow the momentum, but January 2025 marked a new all-time high at 6127.41. In this context, the next bullish target appears to be around the psychologically significant levels of 6250 to 6300. If the bears manage to regain control, the key downside targets on higher timeframes will be the Ichimoku indicator levels: the monthly short-term trend at 5608.41 and the weekly cross supports at Tenkan 5948.42 and Kijun 5608.41.
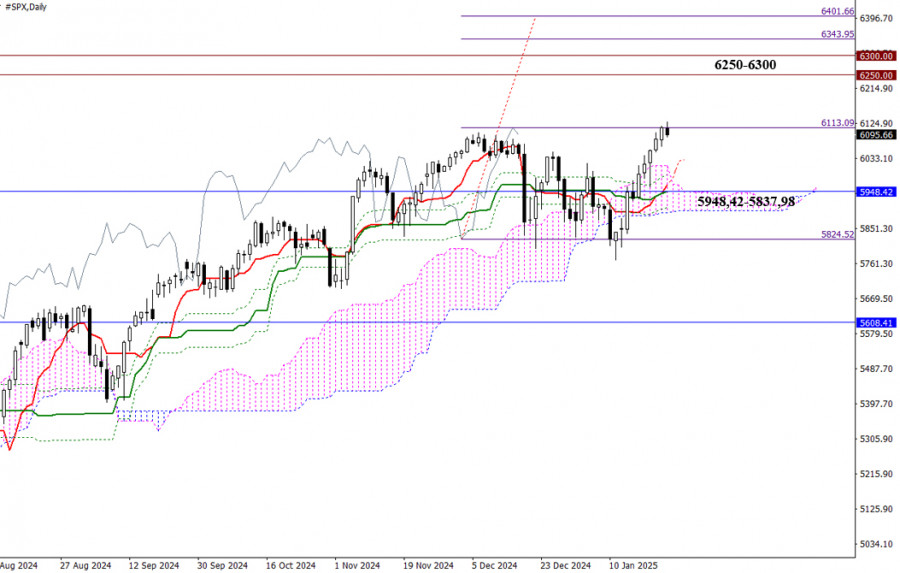
The daily chart indicates that after concluding last year with an emerging bearish correction, the index has rebounded effectively. The bulls successfully halted the decline, eliminated the daily dead cross, returned to the bullish zone above the daily cloud, and targeted an upward breakout for the Chinkou price chart. Currently, the bulls have a strong foundation to continue their upward movement. While the Chinkou Span suggests higher targets in the range of 6344 to 6402, the immediate focus should be on testing the 6250 to 6300 levels and assessing the results of this interaction. If the bulls are unable to breach these levels, the bears could push the market back towards a cluster of multiple supports, which includes the daily cross and daily cloud, near the weekly short-term trend of 5948.42. A decisive break below the range of 5948.42 to 5837.98 could set the stage for a daily downtrend and initiate a new phase of weekly bearish correction.
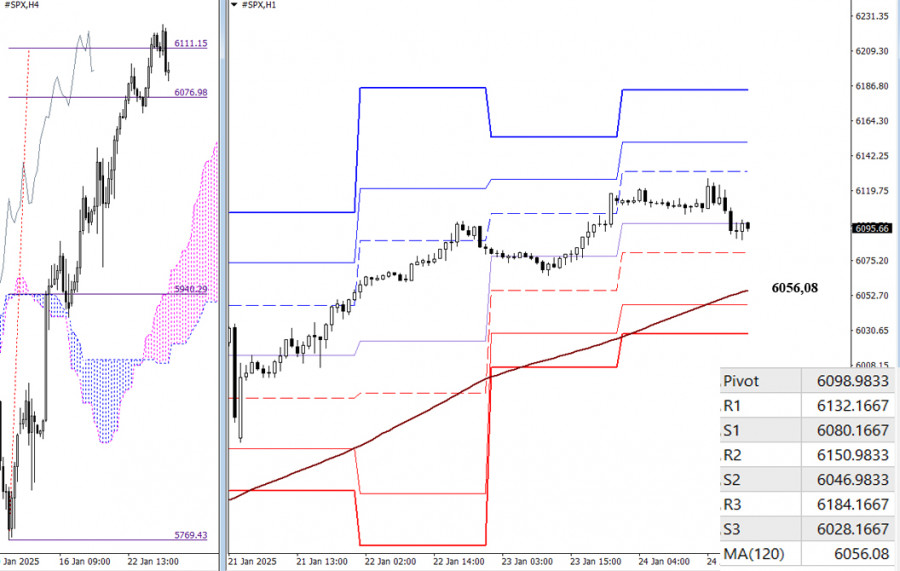
Last week, the H4 chart completed an upward movement, successfully breaking through the H4 Ichimoku cloud at 6111.15. This situation indicates that the bulls may pause, as they might lack the momentum needed for a sustained breakout and further rally. The bears are likely to take advantage of this opportunity, aiming to regain control of the lower timeframes and shift the balance of power in their favor. For the bears to succeed, they need to push the market below the weekly long-term trend at 6056.08 while reversing its current direction.
If the bulls manage to surpass the resistance at the H4 target, we can expect a resurgence of bullish activity. Additionally, the classic Pivot Points offer more references for lower timeframes. New levels will be available when the market opens.
***
You have already liked this post today
*The market analysis posted here is meant to increase your awareness, but not to give instructions to make a trade.


