See also


 09.12.2022 04:00 PM
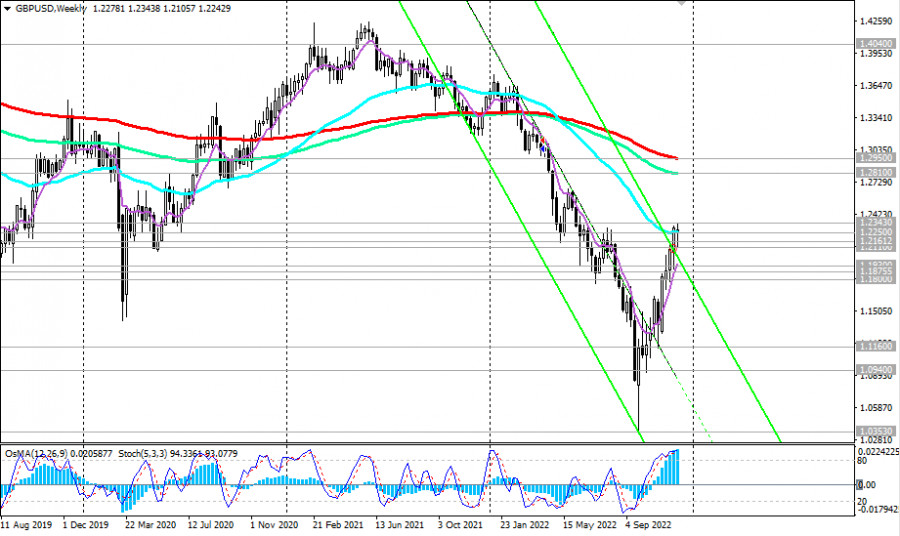
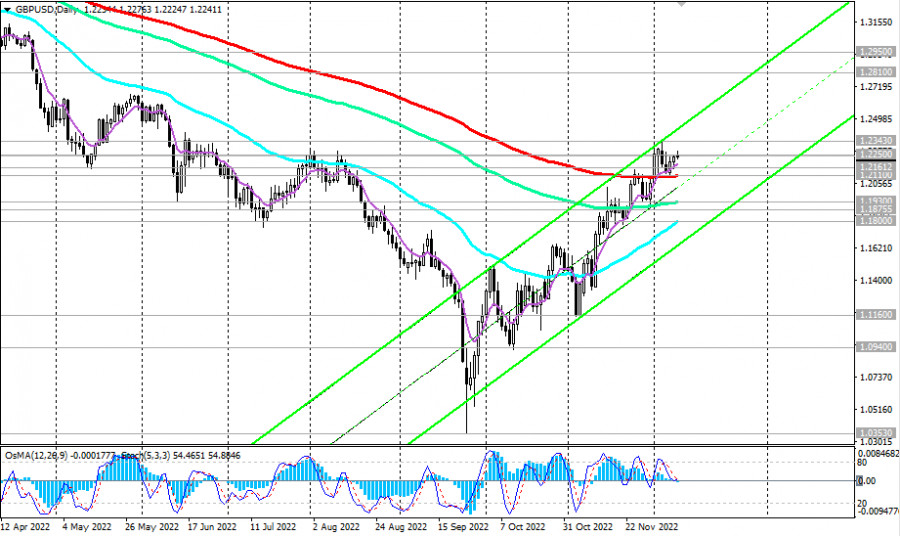
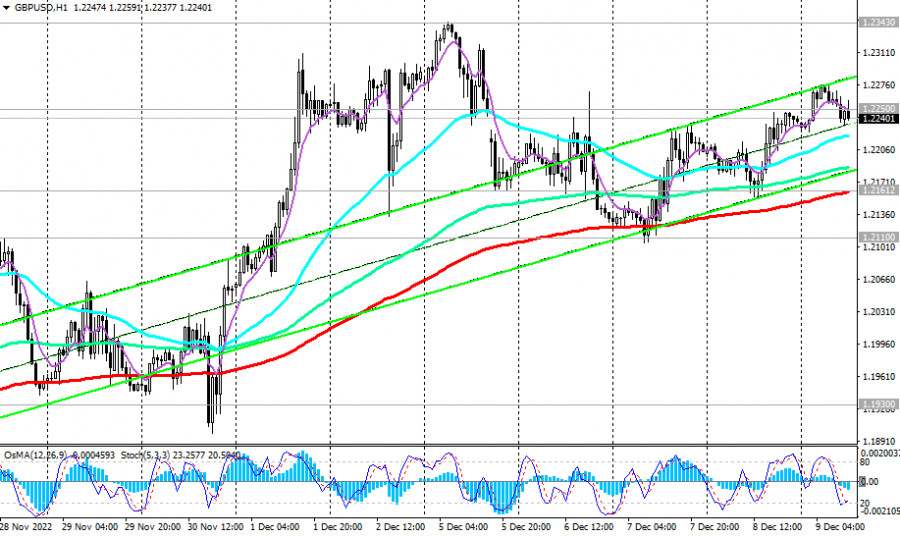
As of writing, GBPUSD is trading near the level of 1.2240, in the zone of the medium-term bull market, above support levels 1.2110 (200 EMA on the daily chart), 1.1930 (144 EMA on the daily chart), 1.1875 (200 EMA on the 4-hour chart).
Since the end of September, the GBP/USD has been developing an upward trend, taking advantage of both the weak dollar and the measures taken by the Bank of England to support the British government bond market.
The breakout of the long-term resistance level 1.2250 (50 EMA on the weekly chart), local resistance level 1.2343 (highs since July and December), 1.2500 (upper boundary of the ascending channel on the daily chart) are on the way. The growth targets are the key resistance levels 1.2810 (144 EMA on the weekly chart), 1.2950 (200 EMA on the weekly chart), separating the long-term bull market from the bear market.
An alternative scenario will be associated with a breakdown of the 1.2110 support level and a further decline deep into the descending channel on the weekly chart.
The breakout of support levels 1.1875, 1.1800 (50 EMA on the daily chart) will confirm this scenario.
In the meantime, above support levels 1.2161 (200 EMA on the 1-hour chart), 1.2100, long positions remain preferable.
Support levels: 1.2200, 1.2161, 1.2100, 1.2000, 1.1930, 1.1875, 1.1800
Resistance levels: 1.2250, 1.2300, 1.2343, 1.2400, 1.2500
Trading Tips
Sell Stop 1.2220. Stop-Loss 1.2310. Take-Profit 1.2200, 1.2161, 1.2100, 1.2000, 1.1930, 1.1875, 1.1800, 1.1575, 1.1500, 1.1400, 1.1300, 1.1200, 1.1160, 1.0940
Buy Stop 1.2310. Stop-Loss 1.2220. Take-Profit 1.2343, 1.2400, 1.2500
You have already liked this post today
*The market analysis posted here is meant to increase your awareness, but not to give instructions to make a trade.
Analysis of Wednesday's Trades 1H Chart of GBP/USD The GBP/USD pair showed no notable movements on Wednesday. After Jerome Powell stated the need for more time to assess the full
Analysis of Wednesday's Trades 1H Chart of EUR/USD The EUR/USD currency pair continued to trade within the sideways channel on Wednesday, which is visible on the hourly timeframe
On Wednesday, the GBP/USD currency pair continued trading within a sideways channel, clearly visible on the hourly timeframe. There was virtually no movement throughout the day, and no fundamental
On Wednesday, the EUR/USD currency pair continued to trade in the same flat range. The 1.1274 and 1.1426 levels bound the broader sideways channel, while the narrower channel ranges between
In my morning forecast, I highlighted the 1.1379 level and planned to base market entry decisions around it. Let's look at the 5-minute chart to understand what happened. A rise
Analysis of Tuesday's Trades 1H Chart of GBP/USD The GBP/USD pair exhibited a notable upward movement on Tuesday, although it remains within a sideways channel that may not be immediately
Analysis of Tuesday's Trades 1H Chart of EUR/USD On Tuesday, the EUR/USD currency pair traded completely flat. Throughout the day, there were no significant reports or events either
InstaTrade
PAMM accounts

Your IP address shows that you are currently located in the USA. If you are a resident of the United States, you are prohibited from using the services of InstaFintech Group including online trading, online transfers, deposit/withdrawal of funds, etc.
If you think you are seeing this message by mistake and your location is not the US, kindly proceed to the website. Otherwise, you must leave the website in order to comply with government restrictions.
Why does your IP address show your location as the USA?
Please confirm whether you are a US resident or not by clicking the relevant button below. If you choose the wrong option, being a US resident, you will not be able to open an account with InstaTrade anyway.
We are sorry for any inconvenience caused by this message.


