See also


 18.10.2022 03:38 PM
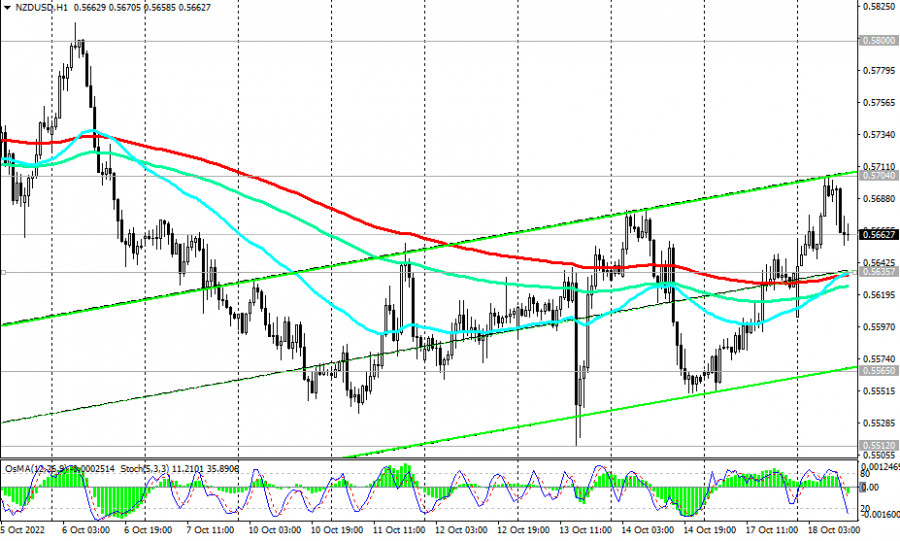
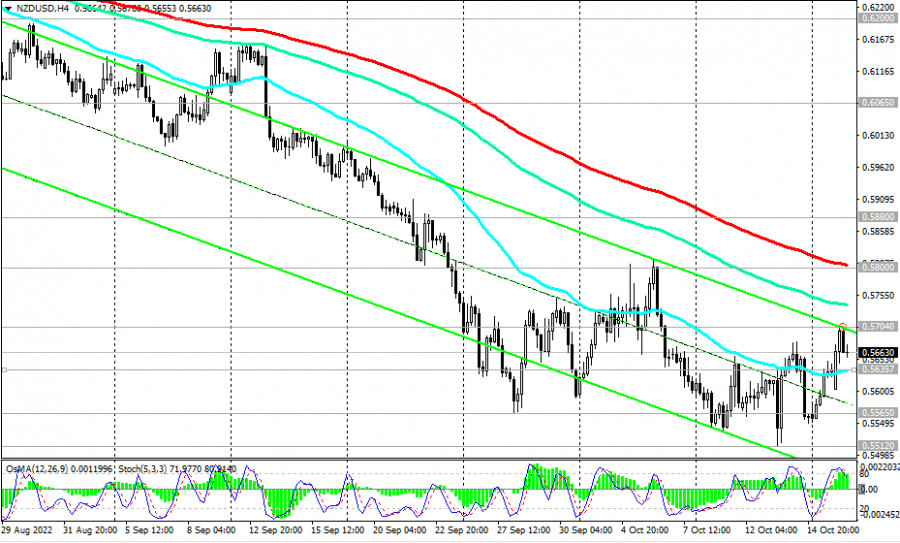
Today, NZD/USD half retains the bullish momentum gained from the inflation data in New Zealand that exceeded the forecast, while also trying to stay in the zone above the short-term important support level of 0.5635 (200 EMA on the 1-hour chart). As of writing, the pair is trading near the 0.5662 mark. It is characteristic that the OsMA and Stochastic technical indicators paint a contradictory picture: on the daily and weekly charts they turn to long positions, and on the 1-hour and 4-hour charts they turn to short positions, signaling the end of the upward correction.
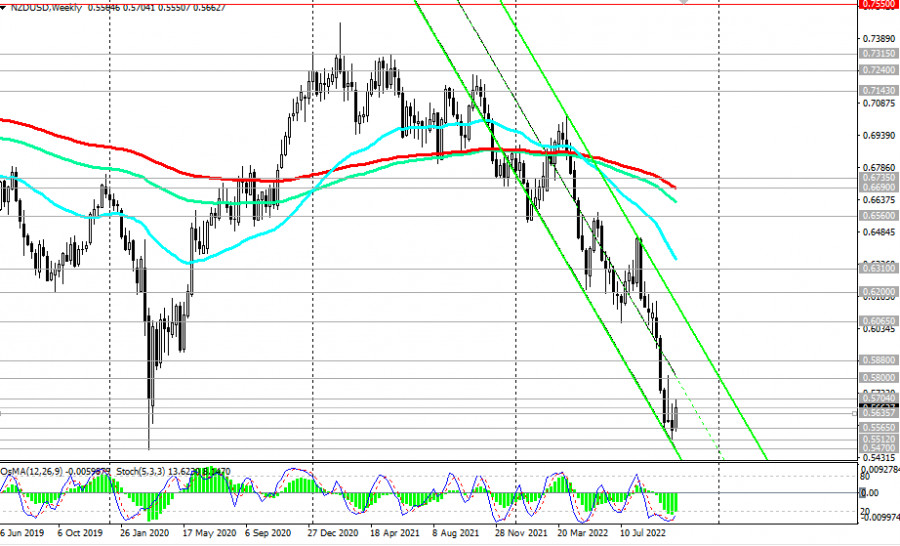
The signal for the resumption of sales will be a breakdown of the support level of 0.5635. In this case, NZD/USD will head deeper into the descending channel on the weekly chart and towards 0.5470.
In an alternative scenario, the upward correction will continue to the resistance levels of 0.5800 (200 EMA on the 4-hour chart), 0.5880 (50 EMA on the daily chart).
In general, the downward dynamics of NZD/USD prevails, while the pair remains in the zone of a long-term bear market—below the key resistance levels of 0.6690 (200 EMA on the weekly chart), 0.6310 (200 EMA on the daily chart). Only their breakdown will bring the pair back into the zone of a long-term bull market.
And today, the volatility in the NZD/USD pair may increase again (in the period after 13:15 - 14:00 GMT), which will be associated with the publication of macro statistics for the US and New Zealand, as well as at 21:30 during the speech of Fed representative Neel Kashkari.
Support levels: 0.5635, 0.5600, 0.5565, 0.5512, 0.5470
Resistance levels: 0.5704, 0.5800, 0.5880, 0.6065, 0.6200, 0.6310, 0.6560, 0.6690, 0.6735
Trading Tips
Sell Stop 0.5620. Stop-Loss 0.5710. Take-Profit 0.5600, 0.5565, 0.5512, 0.5470
Buy Stop 0.5710. Stop-Loss 0.56250. Take-Profit 0.5800, 0.5880, 0.6065, 0.6200, 0.6310, 0.6560, 0.6690, 0.6735
You have already liked this post today
*The market analysis posted here is meant to increase your awareness, but not to give instructions to make a trade.
There are no macroeconomic events scheduled for Friday. Fundamental developments will also be limited, but it's entirely unclear which factors influence price formation. The pound and the euro had reasons
Analysis of Thursday's Trades 1H Chart of GBP/USD On Thursday, the GBP/USD pair continued its choppy decline within the sideways channel and failed to break out, unlike the EUR/USD pair
Analysis of Thursday's Trades 1H Chart of EUR/USD On Thursday, the EUR/USD currency pair unexpectedly exited the sideways channel where it had been trading for three weeks. This occurred during
On Thursday, the GBP/USD currency pair continued trading within the sideways channel, visible in the hourly timeframe. Two central bank meetings — each of which could be considered favorable
The EUR/USD currency pair exhibited a particularly interesting trend on Thursday. As a reminder, the FOMC meeting results were announced Wednesday evening, and we once again considered them hawkish. It's
Analysis of Wednesday's Trades 1H Chart of GBP/USD The GBP/USD pair showed no notable movements on Wednesday. After Jerome Powell stated the need for more time to assess the full
InstaTrade video
analytics
Daily analytical reviews
Training video

Your IP address shows that you are currently located in the USA. If you are a resident of the United States, you are prohibited from using the services of InstaFintech Group including online trading, online transfers, deposit/withdrawal of funds, etc.
If you think you are seeing this message by mistake and your location is not the US, kindly proceed to the website. Otherwise, you must leave the website in order to comply with government restrictions.
Why does your IP address show your location as the USA?
Please confirm whether you are a US resident or not by clicking the relevant button below. If you choose the wrong option, being a US resident, you will not be able to open an account with InstaTrade anyway.
We are sorry for any inconvenience caused by this message.


