See also


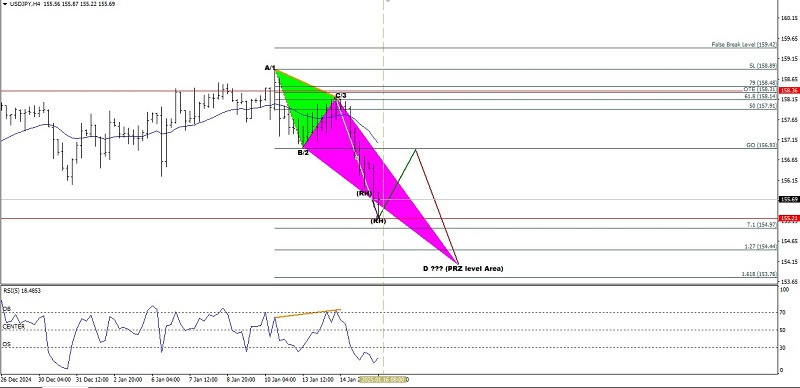
On the 4-hour chart of the main currency pair USD/JPY, there are appearance of Bullish AB=CD Harmonic pattern, where the confirmation of its price movement moving below the EMA 21 and the appearance of convergence between the USD/JPY price movement and the RSI indicator (5) confirms that in the near future USD/JPY will continue to weaken again, where as long as there is no strengthening that breaks through the 158.50 level, this currency pair will continue to weaken, where the 155.21 level will be tested in the near future and if this level is successfully broke and closes below it, USD/JPY will head to the PRZ (Point Reversal Zone) area, namely point D in the range of 154.44-153.76.
(Disclaimer)
You have already liked this post today
*The market analysis posted here is meant to increase your awareness, but not to give instructions to make a trade.


