

Actual patterns

Patterns are graphical models which are formed in the chart by the price. According to one of the technical analysis postulates, history (price movement) repeats itself. It means that the price movements are often similar in the same situations which makes it possible to predict the further development of the situation with a high probability.
Relevant patterns by InstaTrade is an easy-to-use service which allows you to be aware of latest changes in the market and react to clues from the market in time. In our service you will always find the latest and most relevant patterns on any pair and any timeframe.
Bearish Symmetrical Triangle
was formed on 21.03 at 02:30:36 (UTC+0)
signal strength 2 of 5
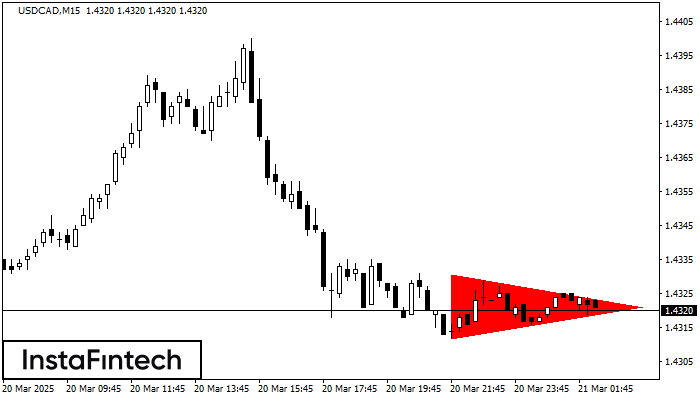
According to the chart of M15, USDCAD formed the Bearish Symmetrical Triangle pattern. Trading recommendations: A breach of the lower border 1.4312 is likely to encourage a continuation of the downward trend.
The M5 and M15 time frames may have more false entry points.
- All
- All
- Bearish Rectangle
- Bearish Symmetrical Triangle
- Bearish Symmetrical Triangle
- Bullish Rectangle
- Double Top
- Double Top
- Triple Bottom
- Triple Bottom
- Triple Top
- Triple Top
- All
- All
- Buy
- Sale
- All
- 1
- 2
- 3
- 4
- 5
Double Top
was formed on 09.05 at 02:15:13 (UTC+0)
signal strength 2 of 5
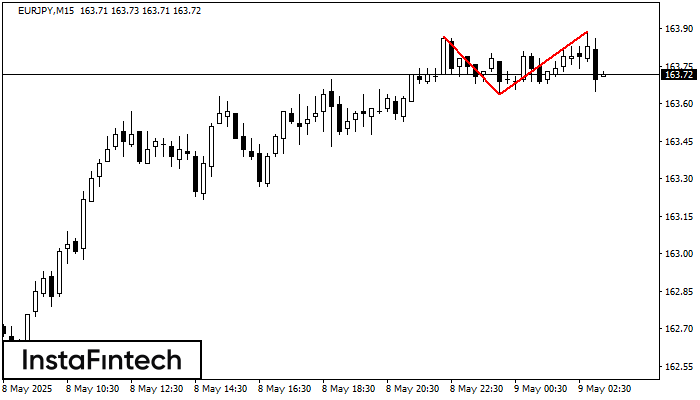
Pada carta EURJPY M15 corak pembalikan Double Top telah terbentuk. Ciri-ciri: sempadan atas 163.89; sempadan bawah 163.64; lebar corak 25 mata. Isyarat: penembusan sempadan bawah akan menyebabkan kesinambungan arah aliran
Carta masa M5 dan M15 mungkin mempunyai lebih banyak titik kemasukan palsu.
Open chart in a new window
Double Top
was formed on 09.05 at 02:09:54 (UTC+0)
signal strength 1 of 5
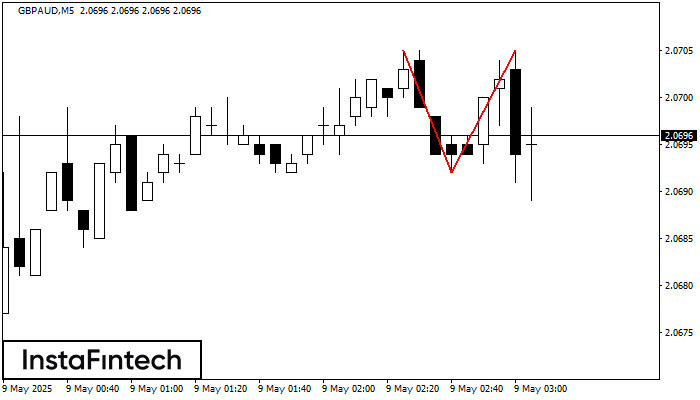
Pada carta GBPAUD M5 corak pembalikan Double Top telah terbentuk. Ciri-ciri: sempadan atas 2.0705; sempadan bawah 2.0692; lebar corak 13 mata. Isyarat: penembusan sempadan bawah akan menyebabkan kesinambungan arah aliran
Carta masa M5 dan M15 mungkin mempunyai lebih banyak titik kemasukan palsu.
Open chart in a new window
Triple Bottom
was formed on 09.05 at 01:00:28 (UTC+0)
signal strength 4 of 5
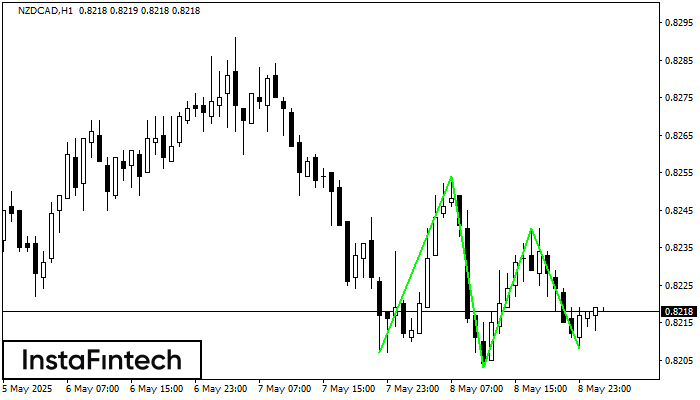
Corak Triple Bottom telah dibentuk pada carta NZDCAD H1. Ciri-ciri corak: Garisan bawah corak mempunyai koordinat 0.8254 dengan had atas 0.8254/0.8240, unjuran lebar adalah 47 mata. Pembentukan corak Triple Bottom
Open chart in a new window


