
GBPHUF (British Pound vs Hungarian Forint). Exchange rate and online charts.
Currency converter
24 Mar 2025 19:45
(-0%)
Closing price, the previous day.
Opening price.
The highest price over the last trading day.
The lowest price over the last trading day
Price range high in the last week
Price range low in the last week
The GBP/HUF currency pair is not popular on Forex. The U.S. dollar has a great effect on GBP/HUF as the currency pair represents the cross rate against the greenback. Thus, by merging the GBP/USD and USD/HUF price charts, it is possible to plot the GBP/HUF price chart.
The U.S. dollar has a significant influence on both currencies. Hence, economic data on the discount rate, GDP, unemployment, new created workplaces and many others from the USA is very important for correct prediction of the currency pair movements. However, Is necessary to note that discussed currencies could respond with different speed on changes in the U.S. economy, therefore, GBPHUF currency pair may be a specific indicator of change at these currencies.
Hungary has huge foreign reserves, that is why the country's economy is highly dependent on those organizations and countries that operate within its territory.
Hungary is an advanced industrial country of Central Europe. Hungarian economy is primarily based on engineering, metallurgy, and chemical industries. Moreover, it has a very developed agricultural sector, including gardening and wine-making industries. Most of the country's products are exported abroad. International tourism positively contributes to the country's economy. Millions of foreigners visit Hungary annually, as they attracted by the nature, long-standing traditions, and architecture. Hungary's main trading partners are the EU countries and Russia. When trading GBP/HUF, pay attention to the economic indicators of the mentioned above countries.
It is necessary to remember that brokers, as a rule, set a higher spread on the crosses than major currency pairs. So, before you start working with the cross rates, familiarize yourself with the terms and conditions offered by the broker on the specified trading instrument.
See Also
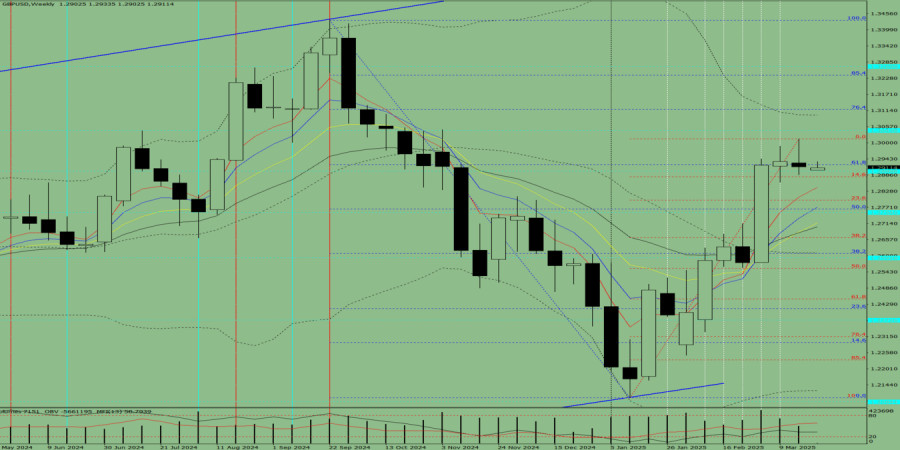
- Last week, the pair moved downward and tested the 14.6% retracement level at 1.2879 (red dashed line), closing the weekly candle at 1.2915. In the upcoming week, the price may continue moving upward.
Author: Stefan Doll
14:24 2025-03-24 UTC+2
1063
Technical analysis / Video analytics
Forex forecast 24/03/2025: EUR/USD, GBP/USD, USD/JPY, Gold and Bitcoin
Technical analysis of EUR/USD, GBP/USD, USD/JPY, Gold and Bitcoin.Author: Sebastian Seliga
15:34 2025-03-24 UTC+2
808
Wave analysis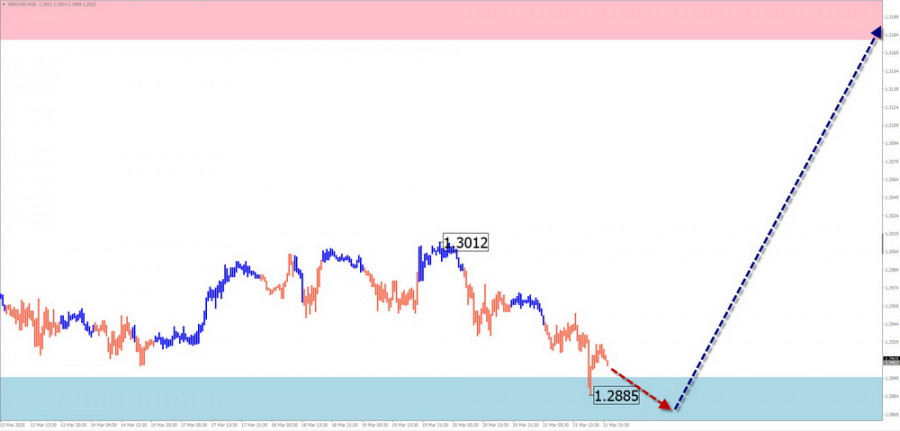
Weekly Forecast Based on Simplified Wave Analysis for GBP/USD, AUD/USD, USD/CHF, EUR/JPY, #Ethereum, #Litecoin – March 24th
In the coming days, GBP is expected to move sideways with a flat bias. Pressure on the lower boundary of the support zone is possible, followed by stabilization and the formation of reversal conditions.Author: Isabel Clark
12:21 2025-03-24 UTC+2
763
- The outcomes of the Bank of England and FOMC meetings contradicted each other.
Author: Samir Klishi
12:25 2025-03-24 UTC+2
733
Wave analysis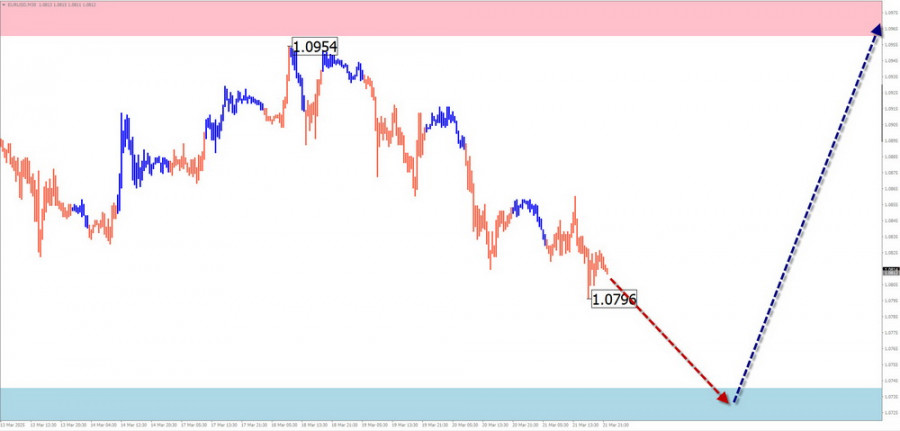
Weekly Forecast Based on Simplified Wave Analysis: EUR/USD, USD/JPY, GBP/JPY, USD/CAD, #Bitcoin, #Ripple – March 24th
A continuation of the overall sideways movement of the euro is expected in the coming week, fluctuating between the nearest opposing zones. A downward vector is more likely in the early days.Author: Isabel Clark
12:13 2025-03-24 UTC+2
718
The bulls attacked for two weeks, but now it's time for a pause.Author: Samir Klishi
13:55 2025-03-24 UTC+2
688
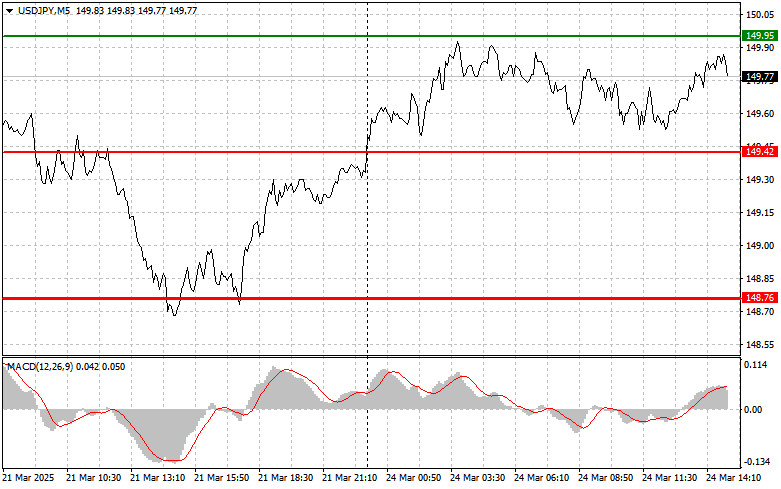
- USDJPY: Simple Trading Tips for Beginner Traders on March 24th (U.S. Session)
Author: Jakub Novak
17:13 2025-03-24 UTC+2
643
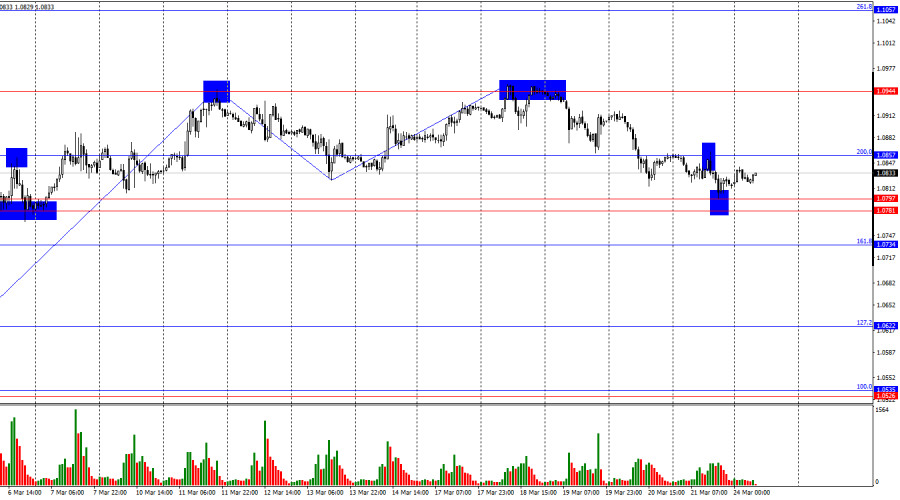
Last week, the pair moved downward and tested the historical resistance level of 1.0948 (light blue dashed line), after which the price declined and closed the weekly candle at 1.0815. In the upcoming week, the price may continue moving upward.Author: Stefan Doll
14:22 2025-03-24 UTC+2
643
Technical analysis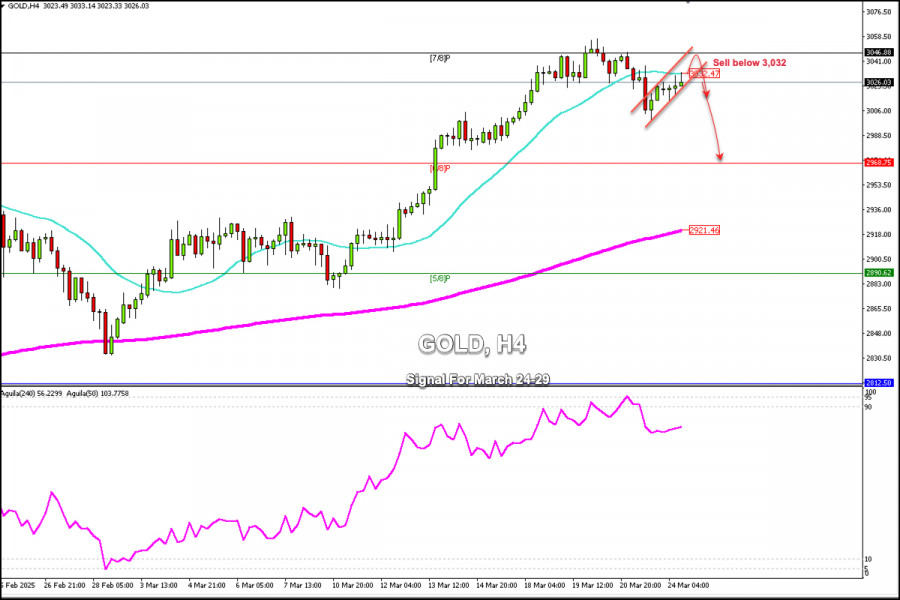
Trading Signals for GOLD (XAU/USD) for March 24-27, 2025: sell below $3,032 (21 SMA - overbought)
The eagle indicator is reaching overbought levels, so we believe a technical correction could occur in the coming days, before resuming its bullish cycle.Author: Dimitrios Zappas
17:44 2025-03-24 UTC+2
613
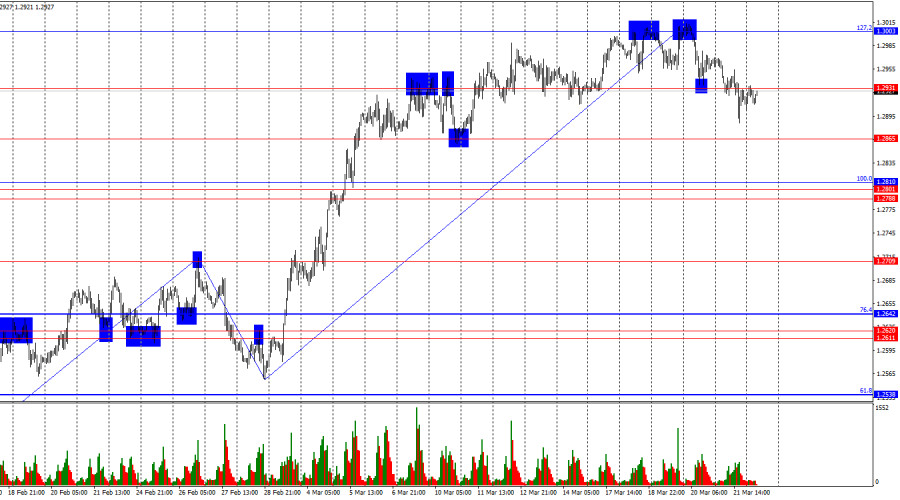
- Last week, the pair moved downward and tested the 14.6% retracement level at 1.2879 (red dashed line), closing the weekly candle at 1.2915. In the upcoming week, the price may continue moving upward.
Author: Stefan Doll
14:24 2025-03-24 UTC+2
1063
- Technical analysis / Video analytics
Forex forecast 24/03/2025: EUR/USD, GBP/USD, USD/JPY, Gold and Bitcoin
Technical analysis of EUR/USD, GBP/USD, USD/JPY, Gold and Bitcoin.Author: Sebastian Seliga
15:34 2025-03-24 UTC+2
808
- Wave analysis
Weekly Forecast Based on Simplified Wave Analysis for GBP/USD, AUD/USD, USD/CHF, EUR/JPY, #Ethereum, #Litecoin – March 24th
In the coming days, GBP is expected to move sideways with a flat bias. Pressure on the lower boundary of the support zone is possible, followed by stabilization and the formation of reversal conditions.Author: Isabel Clark
12:21 2025-03-24 UTC+2
763
- The outcomes of the Bank of England and FOMC meetings contradicted each other.
Author: Samir Klishi
12:25 2025-03-24 UTC+2
733
- Wave analysis
Weekly Forecast Based on Simplified Wave Analysis: EUR/USD, USD/JPY, GBP/JPY, USD/CAD, #Bitcoin, #Ripple – March 24th
A continuation of the overall sideways movement of the euro is expected in the coming week, fluctuating between the nearest opposing zones. A downward vector is more likely in the early days.Author: Isabel Clark
12:13 2025-03-24 UTC+2
718
- The bulls attacked for two weeks, but now it's time for a pause.
Author: Samir Klishi
13:55 2025-03-24 UTC+2
688
- USDJPY: Simple Trading Tips for Beginner Traders on March 24th (U.S. Session)
Author: Jakub Novak
17:13 2025-03-24 UTC+2
643
- Last week, the pair moved downward and tested the historical resistance level of 1.0948 (light blue dashed line), after which the price declined and closed the weekly candle at 1.0815. In the upcoming week, the price may continue moving upward.
Author: Stefan Doll
14:22 2025-03-24 UTC+2
643
- Technical analysis
Trading Signals for GOLD (XAU/USD) for March 24-27, 2025: sell below $3,032 (21 SMA - overbought)
The eagle indicator is reaching overbought levels, so we believe a technical correction could occur in the coming days, before resuming its bullish cycle.Author: Dimitrios Zappas
17:44 2025-03-24 UTC+2
613


