Actual patterns

Patterns are graphical models which are formed in the chart by the price. According to one of the technical analysis postulates, history (price movement) repeats itself. It means that the price movements are often similar in the same situations which makes it possible to predict the further development of the situation with a high probability.
Relevant patterns by InstaTrade is an easy-to-use service which allows you to be aware of latest changes in the market and react to clues from the market in time. In our service you will always find the latest and most relevant patterns on any pair and any timeframe.
Inverse Head and Shoulder
was formed on 14.04 at 23:05:42 (UTC+0)
signal strength 1 of 5
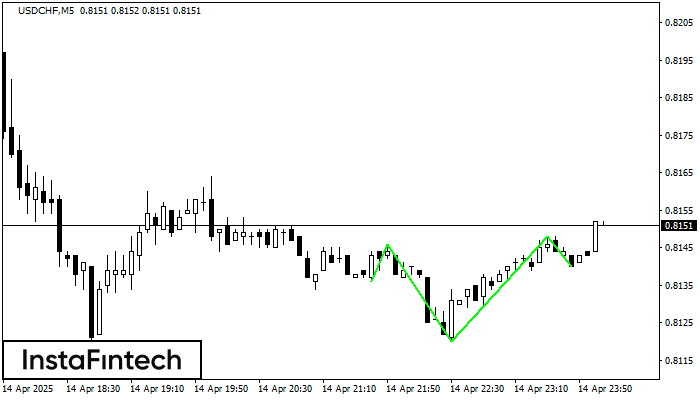
According to the chart of M5, USDCHF formed the Inverse Head and Shoulder pattern. The Head’s top is set at 0.8148 while the median line of the Neck is found at 0.8120/0.8140. The formation of the Inverse Head and Shoulder pattern evidently signals a reversal of the downward trend. In other words, in case the scenario comes true, the price of USDCHF will go towards 0.8163
The M5 and M15 time frames may have more false entry points.
See Also
- All
- All
- Bearish Rectangle
- Bearish Symmetrical Triangle
- Bearish Symmetrical Triangle
- Bullish Rectangle
- Double Top
- Double Top
- Triple Bottom
- Triple Bottom
- Triple Top
- Triple Top
- All
- All
- Buy
- Sale
- All
- 1
- 2
- 3
- 4
- 5
Kepala dan Bahu Terbalik
was formed on 02.05 at 12:00:11 (UTC+0)
signal strength 4 of 5
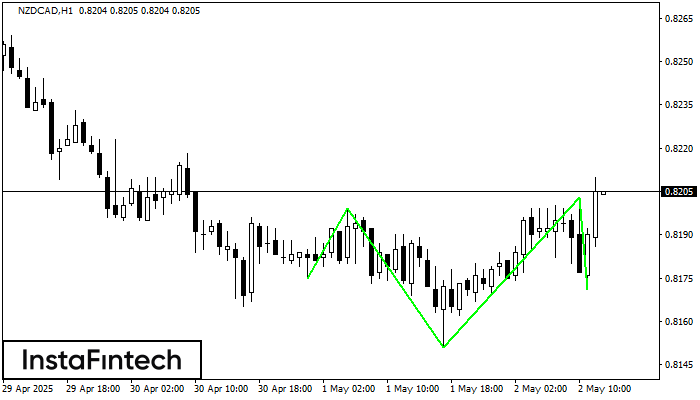
Menurut grafik H1, NZDCAD menghasilkan pola yang disebut Kepala dan Bahu Terbalik. The Head ditetapkan di 0.8151 sementara garis median The Neck ditetapkan di 0.8199/0.8203. Formasi Pola Kepala dan Bahu
Open chart in a new window
Teratas Triple
was formed on 02.05 at 11:00:30 (UTC+0)
signal strength 4 of 5
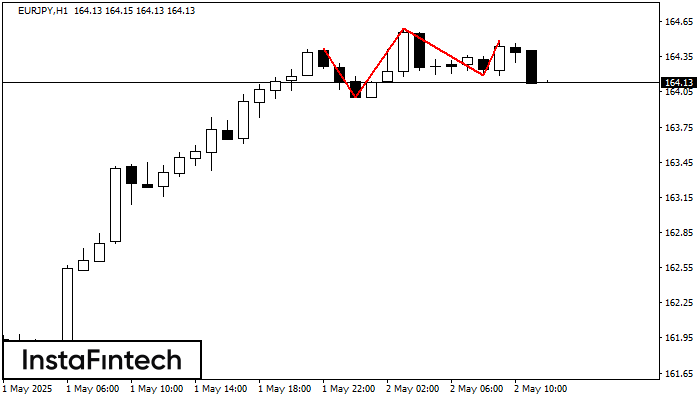
Pola Teratas Triple telah terbentuk pada grafik instrumen trading EURJPY H1. Pola tersebut merupakan pola reversal menampilkan karakteristik berikut: level resistance -7, levek support -19, dan lebar pola 42. Prakiraan
Open chart in a new window
Teratas Triple
was formed on 02.05 at 11:00:11 (UTC+0)
signal strength 3 of 5
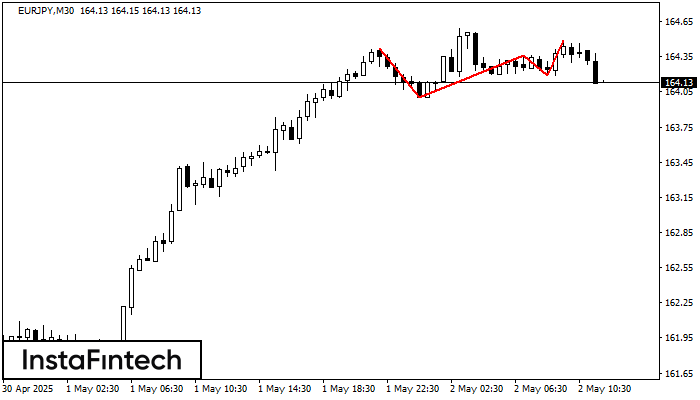
Pola Teratas Triple telah terbentuk pada grafik instrumen trading EURJPY M30. Pola tersebut merupakan pola reversal menampilkan karakteristik berikut: level resistance -7, levek support -19, dan lebar pola 42. Prakiraan
Open chart in a new window