

Actual patterns

Patterns are graphical models which are formed in the chart by the price. According to one of the technical analysis postulates, history (price movement) repeats itself. It means that the price movements are often similar in the same situations which makes it possible to predict the further development of the situation with a high probability.
Relevant patterns by InstaTrade is an easy-to-use service which allows you to be aware of latest changes in the market and react to clues from the market in time. In our service you will always find the latest and most relevant patterns on any pair and any timeframe.
Double Bottom
was formed on 08.04 at 04:15:56 (UTC+0)
signal strength 2 of 5
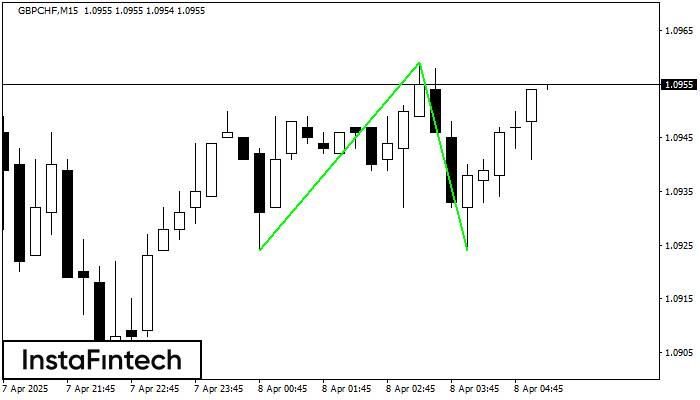
The Double Bottom pattern has been formed on GBPCHF M15. Characteristics: the support level 1.0924; the resistance level 1.0959; the width of the pattern 35 points. If the resistance level is broken, a change in the trend can be predicted with the first target point lying at the distance of 35 points.
The M5 and M15 time frames may have more false entry points.
- All
- All
- Bearish Rectangle
- Bearish Symmetrical Triangle
- Bearish Symmetrical Triangle
- Bullish Rectangle
- Double Top
- Double Top
- Triple Bottom
- Triple Bottom
- Triple Top
- Triple Top
- All
- All
- Buy
- Sale
- All
- 1
- 2
- 3
- 4
- 5
Persegi Bullish
was formed on 02.05 at 06:03:50 (UTC+0)
signal strength 1 of 5
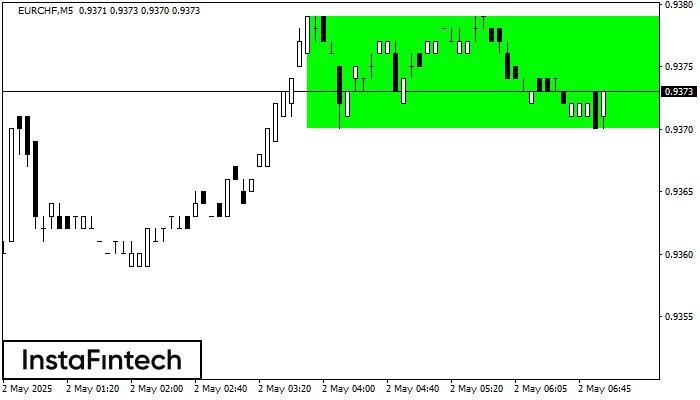
Menurut grafik dari M5, EURCHF terbentuk Persegi Bullish yang merupakan pola dari kelanjutan tren. Pola terkandung dalam batas berikut: batas yang lebih rendah 0.9370 – 0.9370 dan batas atas 0.9379
Rangka waktu M5 dan M15 mungkin memiliki lebih dari titik entri yang keliru.
Open chart in a new window
Bendera Bearish
was formed on 02.05 at 05:53:04 (UTC+0)
signal strength 1 of 5
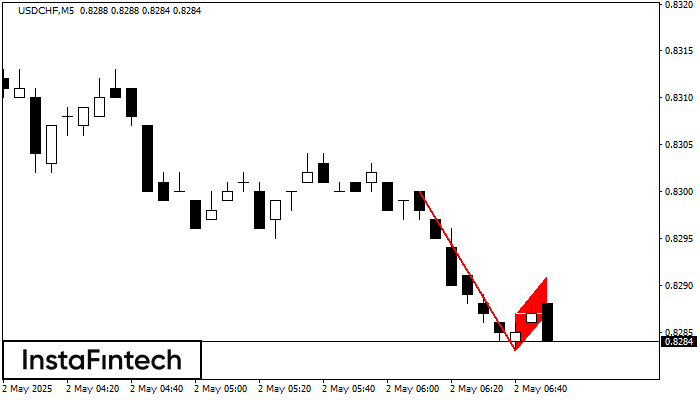
Pola Bendera Bearish telah terbentuk di USDCHF at M5. Batas bawah pola ini terletak di 0.8283/0.8287, sementara batas atas terletak di 0.8287/0.8291. Proyeksi panjang jarum candle 17 poin. Pembentukan
Rangka waktu M5 dan M15 mungkin memiliki lebih dari titik entri yang keliru.
Open chart in a new window
Panji Bearish
was formed on 02.05 at 05:52:58 (UTC+0)
signal strength 1 of 5
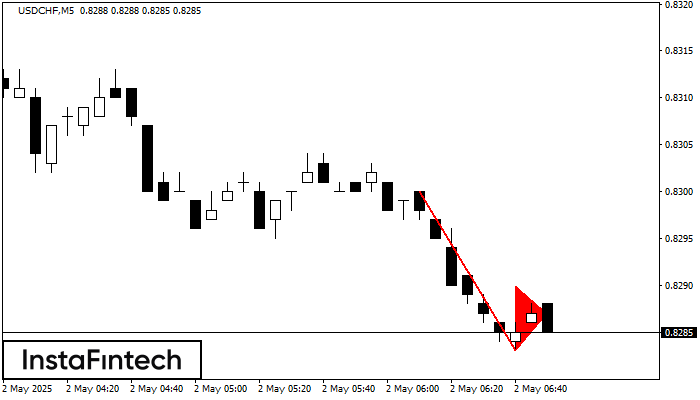
Pola Panji Bearish telah terbentuk di grafik Panji Bearish. Pola ini memberikan sinyal kelanjutan tren menurun jika titik terendah panji, di 0.8283 ditembus. Rekomendasi: Tempatkan sell stop pending order
Rangka waktu M5 dan M15 mungkin memiliki lebih dari titik entri yang keliru.
Open chart in a new window


