

Actual patterns

Patterns are graphical models which are formed in the chart by the price. According to one of the technical analysis postulates, history (price movement) repeats itself. It means that the price movements are often similar in the same situations which makes it possible to predict the further development of the situation with a high probability.
Relevant patterns by InstaTrade is an easy-to-use service which allows you to be aware of latest changes in the market and react to clues from the market in time. In our service you will always find the latest and most relevant patterns on any pair and any timeframe.
Bullish Rectangle
was formed on 03.04 at 05:24:47 (UTC+0)
signal strength 1 of 5
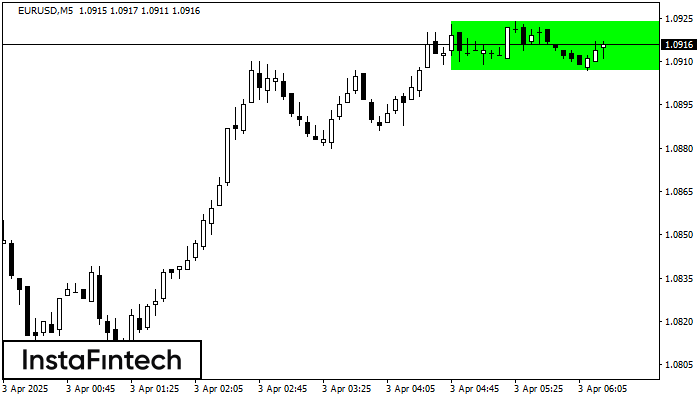
According to the chart of M5, EURUSD formed the Bullish Rectangle which is a pattern of a trend continuation. The pattern is contained within the following borders: the lower border 1.0907 – 1.0907 and upper border 1.0924 – 1.0924. In case the upper border is broken, the instrument is likely to follow the upward trend.
The M5 and M15 time frames may have more false entry points.
See Also
- All
- All
- Bearish Rectangle
- Bearish Symmetrical Triangle
- Bearish Symmetrical Triangle
- Bullish Rectangle
- Double Top
- Double Top
- Triple Bottom
- Triple Bottom
- Triple Top
- Triple Top
- All
- All
- Buy
- Sale
- All
- 1
- 2
- 3
- 4
- 5
Pennant Aliran Menurun
was formed on 21.04 at 21:30:29 (UTC+0)
signal strength 4 of 5

Corak Pennant Aliran Menurun telah dibentuk pada carta #FB H1. Jenis corak ini dicirikan oleh sedikit penurunan di mana selepas itu harga akan bergerak ke arah aliran asal. Sekiranya harga
Open chart in a new window
Triple Bottom
was formed on 21.04 at 21:30:21 (UTC+0)
signal strength 2 of 5

Corak Triple Bottom telah dibentuk pada #AAPL M15. Ia mempunyai ciri-ciri berikut: tahap rintangan 191.73/191.10; tahap sokongan 189.80/190.18; lebar corak adalah 193 mata. Dalam situasi penembusan paras rintangan 191.73, harga
Carta masa M5 dan M15 mungkin mempunyai lebih banyak titik kemasukan palsu.
Open chart in a new window
Double Top
was formed on 21.04 at 21:30:13 (UTC+0)
signal strength 2 of 5
Corak pembalikan Double Top telah dibentuk pada GOLD M15. Ciri-ciri: sempadan atas %P0.000000; sempadan bawah 3429.80; sempadan bawah 3405.54; lebar corak adalah 2449 mata. Dagangan menjual adalah lebih baik untuk
Carta masa M5 dan M15 mungkin mempunyai lebih banyak titik kemasukan palsu.
Open chart in a new window


