

Actual patterns

Patterns are graphical models which are formed in the chart by the price. According to one of the technical analysis postulates, history (price movement) repeats itself. It means that the price movements are often similar in the same situations which makes it possible to predict the further development of the situation with a high probability.
Relevant patterns by InstaTrade is an easy-to-use service which allows you to be aware of latest changes in the market and react to clues from the market in time. In our service you will always find the latest and most relevant patterns on any pair and any timeframe.
Bearish pennant
was formed on 01.04 at 12:50:18 (UTC+0)
signal strength 1 of 5
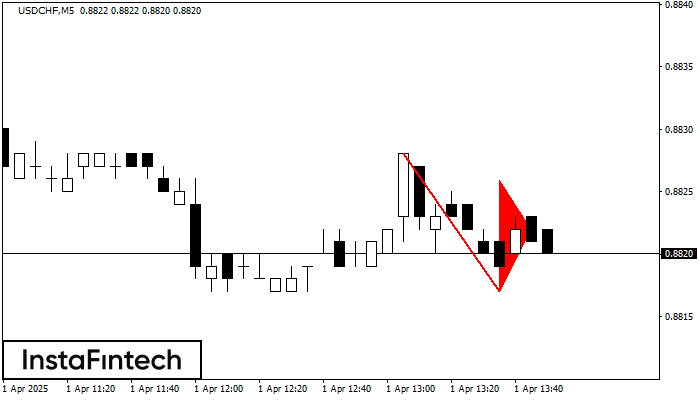
The Bearish pennant pattern has formed on the USDCHF M5 chart. It signals potential continuation of the existing trend. Specifications: the pattern’s bottom has the coordinate of 0.8817; the projection of the flagpole height is equal to 11 pips. In case the price breaks out the pattern’s bottom of 0.8817, the downtrend is expected to continue for further level 0.8802.
The M5 and M15 time frames may have more false entry points.
- All
- All
- Bearish Rectangle
- Bearish Symmetrical Triangle
- Bearish Symmetrical Triangle
- Bullish Rectangle
- Double Top
- Double Top
- Triple Bottom
- Triple Bottom
- Triple Top
- Triple Top
- All
- All
- Buy
- Sale
- All
- 1
- 2
- 3
- 4
- 5
Double Bottom
was formed on 21.04 at 02:15:11 (UTC+0)
signal strength 2 of 5
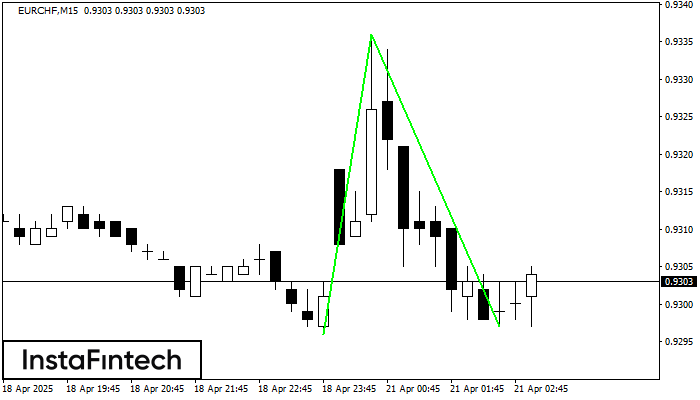
Corak Double Bottom telah dibentuk pada EURCHF M15. Ciri-ciri: tahap sokongan 0.9296; tahap rintangan 0.9336; lebar corak 40 mata. Sekiranya tahap rintangan ditembusi, perubahan aliran boleh diramalkan dengan titik sasaran
Carta masa M5 dan M15 mungkin mempunyai lebih banyak titik kemasukan palsu.
Open chart in a new window
Double Top
was formed on 21.04 at 02:05:24 (UTC+0)
signal strength 1 of 5
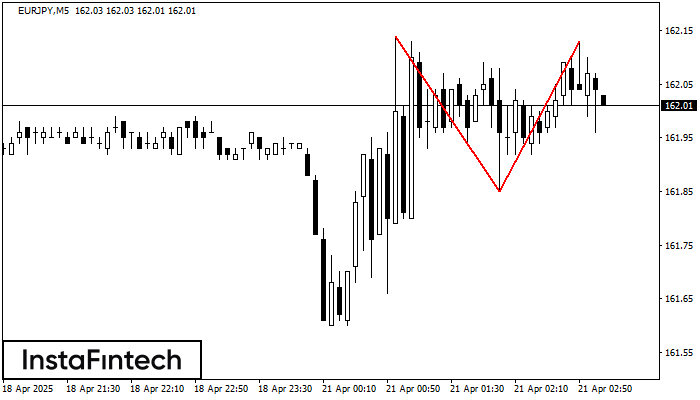
Corak Double Top telah dibentuk pada EURJPY M5. Isyarat bahawa aliran telah berubah dari aliran menaik ke aliran menurun. Mungkin, sekiranya asas corak 161.85 ditembusi, pergerakan menurun akan berterusan
Carta masa M5 dan M15 mungkin mempunyai lebih banyak titik kemasukan palsu.
Open chart in a new window
Double Bottom
was formed on 21.04 at 01:55:14 (UTC+0)
signal strength 1 of 5
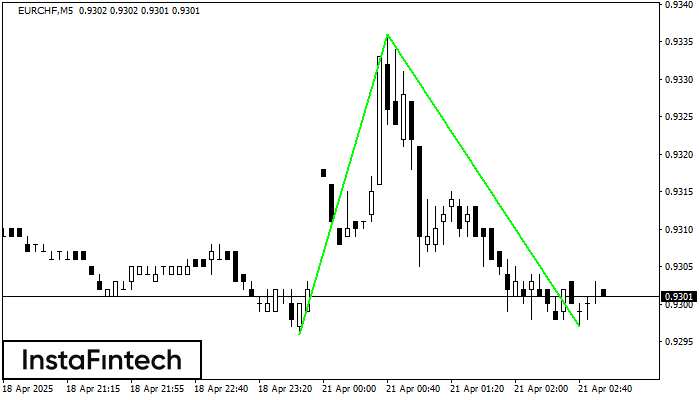
Corak Double Bottom telah dibentuk pada EURCHF M5. Ciri-ciri: tahap sokongan 0.9296; tahap rintangan 0.9336; lebar corak 40 mata. Sekiranya tahap rintangan ditembusi, perubahan aliran boleh diramalkan dengan titik sasaran
Carta masa M5 dan M15 mungkin mempunyai lebih banyak titik kemasukan palsu.
Open chart in a new window


