

Actual patterns

Patterns are graphical models which are formed in the chart by the price. According to one of the technical analysis postulates, history (price movement) repeats itself. It means that the price movements are often similar in the same situations which makes it possible to predict the further development of the situation with a high probability.
Relevant patterns by InstaTrade is an easy-to-use service which allows you to be aware of latest changes in the market and react to clues from the market in time. In our service you will always find the latest and most relevant patterns on any pair and any timeframe.
Double Bottom
was formed on 30.03 at 23:00:31 (UTC+0)
signal strength 3 of 5
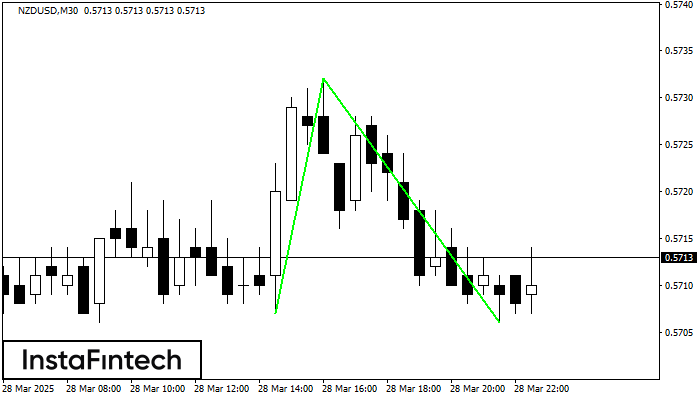
The Double Bottom pattern has been formed on NZDUSD M30. This formation signals a reversal of the trend from downwards to upwards. The signal is that a buy trade should be opened after the upper boundary of the pattern 0.5732 is broken. The further movements will rely on the width of the current pattern 25 points.
See Also
- All
- All
- Bearish Rectangle
- Bearish Symmetrical Triangle
- Bearish Symmetrical Triangle
- Bullish Rectangle
- Double Top
- Double Top
- Triple Bottom
- Triple Bottom
- Triple Top
- Triple Top
- All
- All
- Buy
- Sale
- All
- 1
- 2
- 3
- 4
- 5
Persegi Bearish
was formed on 11.04 at 15:02:18 (UTC+0)
signal strength 3 of 5
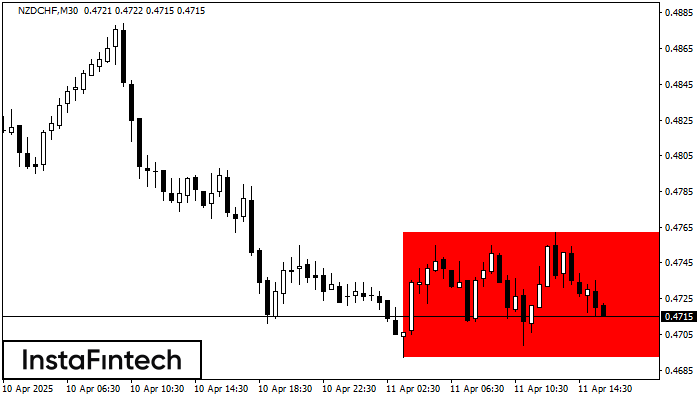
Menurut grafik dari M30, NZDCHF terbentuk Persegi Bearish. Pola menunjukkan kelanjutan tren. Batas atas adalah 0.4762, batas rendah adalah 0.4692. Sinyal berarti posisi jual harus dibuka setelah menetapkan harga dibawah
Open chart in a new window
Persegi Bearish
was formed on 11.04 at 14:48:14 (UTC+0)
signal strength 3 of 5
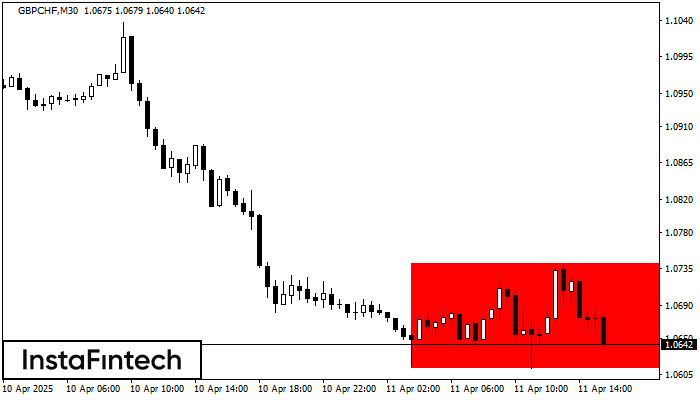
Menurut grafik dari M30, GBPCHF terbentuk Persegi Bearish yang merupakan pola dari kelanjutan tren. Pola terkandung di dalam batas berikut: batas lebih rendah 1.0613 – 1.0613 dan batas atas 1.0742
Open chart in a new window
Persegi Bullish
was formed on 10.04 at 14:30:16 (UTC+0)
signal strength 3 of 5
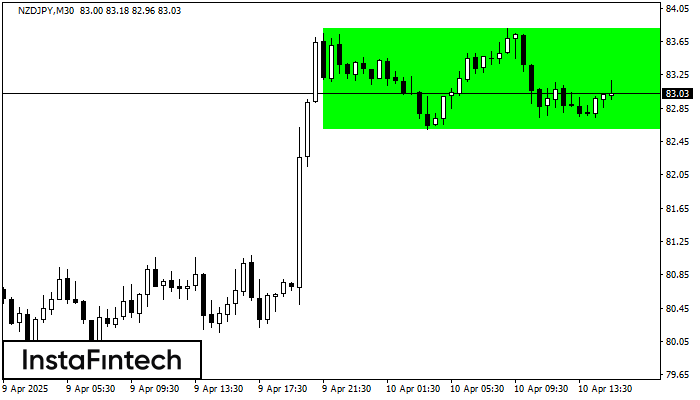
Menurut grafik dari M30, NZDJPY terbentuk Persegi Bullish. Jenis pola ini menunjukkan kelanjutan tren. Terdiri dari dua tingkat: resistance 83.80 dan support 82.60. Jika level resistance 83.80 - 83.80 ditembus
Open chart in a new window


