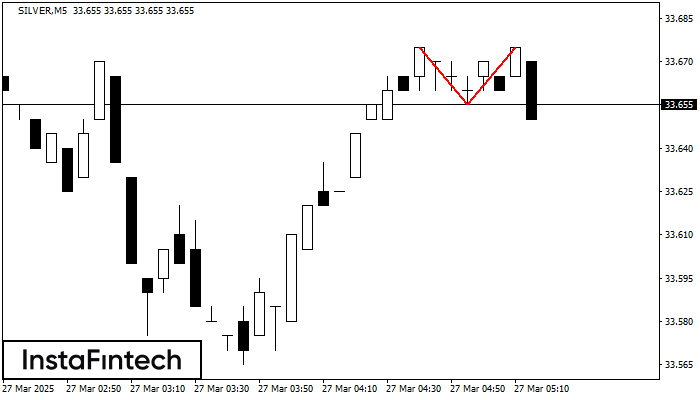
Double Top
was formed on 27.03 at 05:23:08 (UTC+0)
signal strength 1 of 5

The Double Top reversal pattern has been formed on SILVER M5. Characteristics: the upper boundary 33.67; the lower boundary 33.66; the width of the pattern is 20 points. Sell trades are better to be opened below the lower boundary 33.66 with a possible movements towards the 33.64 level.
The M5 and M15 time frames may have more false entry points.
See Also
- All
- All
- Bearish Rectangle
- Bearish Symmetrical Triangle
- Bearish Symmetrical Triangle
- Bullish Rectangle
- Double Top
- Double Top
- Triple Bottom
- Triple Bottom
- Triple Top
- Triple Top
- All
- All
- Buy
- Sale
- All
- 1
- 2
- 3
- 4
- 5
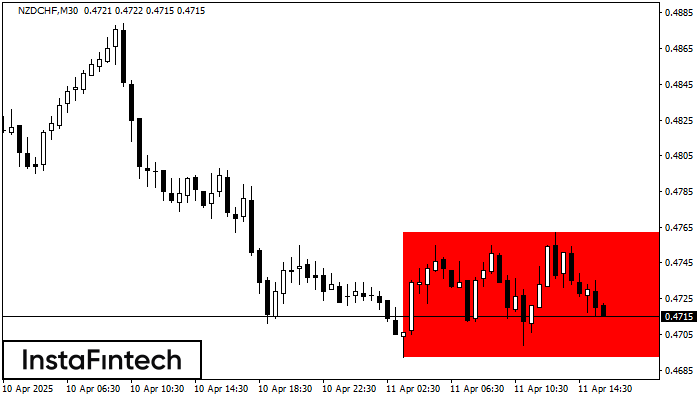
Persegi Bearish
was formed on 11.04 at 15:02:18 (UTC+0)
signal strength 3 of 5
Menurut grafik dari M30, NZDCHF terbentuk Persegi Bearish. Pola menunjukkan kelanjutan tren. Batas atas adalah 0.4762, batas rendah adalah 0.4692. Sinyal berarti posisi jual harus dibuka setelah menetapkan harga dibawah
Open chart in a new window
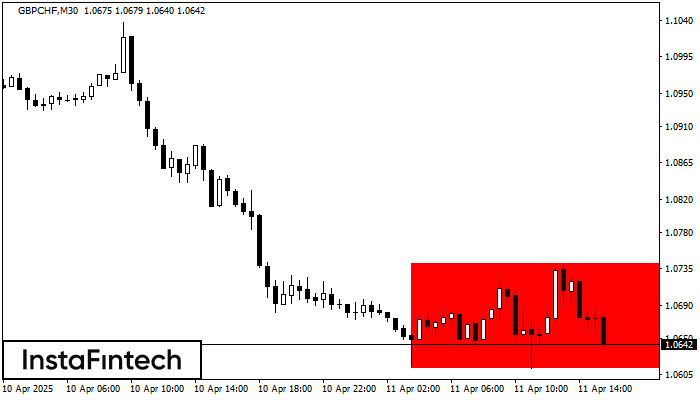
Persegi Bearish
was formed on 11.04 at 14:48:14 (UTC+0)
signal strength 3 of 5
Menurut grafik dari M30, GBPCHF terbentuk Persegi Bearish yang merupakan pola dari kelanjutan tren. Pola terkandung di dalam batas berikut: batas lebih rendah 1.0613 – 1.0613 dan batas atas 1.0742
Open chart in a new window
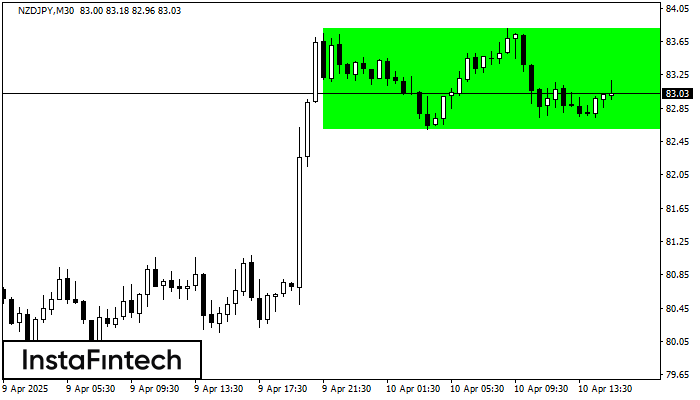
Persegi Bullish
was formed on 10.04 at 14:30:16 (UTC+0)
signal strength 3 of 5
Menurut grafik dari M30, NZDJPY terbentuk Persegi Bullish. Jenis pola ini menunjukkan kelanjutan tren. Terdiri dari dua tingkat: resistance 83.80 dan support 82.60. Jika level resistance 83.80 - 83.80 ditembus
Open chart in a new window


