

Actual patterns

Patterns are graphical models which are formed in the chart by the price. According to one of the technical analysis postulates, history (price movement) repeats itself. It means that the price movements are often similar in the same situations which makes it possible to predict the further development of the situation with a high probability.
Relevant patterns by InstaTrade is an easy-to-use service which allows you to be aware of latest changes in the market and react to clues from the market in time. In our service you will always find the latest and most relevant patterns on any pair and any timeframe.
Bullish Symmetrical Triangle
was formed on 26.03 at 12:20:42 (UTC+0)
signal strength 1 of 5
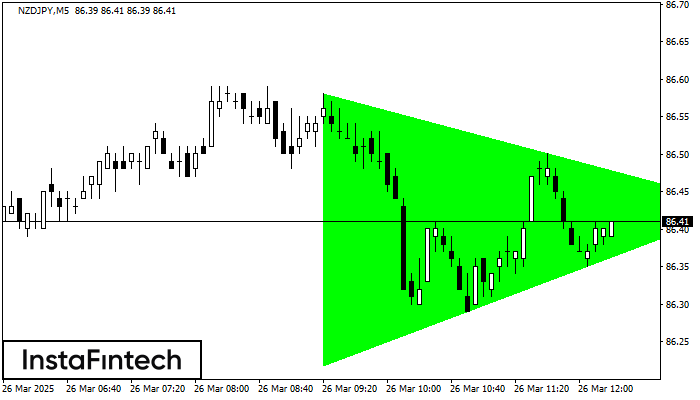
According to the chart of M5, NZDJPY formed the Bullish Symmetrical Triangle pattern, which signals the trend will continue. Description. The upper border of the pattern touches the coordinates 86.58/86.43 whereas the lower border goes across 86.22/86.43. The pattern width is measured on the chart at 36 pips. If the Bullish Symmetrical Triangle pattern is in progress during the upward trend, this indicates the current trend will go on. In case 86.43 is broken, the price could continue its move toward 86.58.
The M5 and M15 time frames may have more false entry points.
See Also
- All
- All
- Bearish Rectangle
- Bearish Symmetrical Triangle
- Bearish Symmetrical Triangle
- Bullish Rectangle
- Double Top
- Double Top
- Triple Bottom
- Triple Bottom
- Triple Top
- Triple Top
- All
- All
- Buy
- Sale
- All
- 1
- 2
- 3
- 4
- 5
Двойное дно
сформирован 03.05 в 10:45:44 (UTC+0)
сила сигнала 2 из 5

Сформирована фигура «Двойное дно» на графике #Bitcoin M15. Данное формирование сигнализирует об изменении тенденции с нисходящего на восходящее движение. Сигнал: Торговую позицию на покупку следует открывать после пробоя верхней границы
Таймфреймы М5 и М15 могут иметь больше ложных точек входа.
Открыть график инструмента в новом окне
Двойное дно
сформирован 03.05 в 08:00:01 (UTC+0)
сила сигнала 3 из 5

Сформирована фигура «Двойное дно» на графике #Bitcoin M30. Верхняя граница 97860.25; Нижняя граница 96258.44; Ширина фигуры 156618 пунктов. В случае пробоя верхней границы 97860.25 можно будет прогнозировать изменение тенденции
Открыть график инструмента в новом окне
Двойное дно
сформирован 03.05 в 06:20:09 (UTC+0)
сила сигнала 1 из 5

Сформирована фигура «Двойное дно» на графике #Bitcoin M5. Верхняя граница 96467.62; Нижняя граница 96258.44; Ширина фигуры 20692 пунктов. В случае пробоя верхней границы 96467.62 можно будет прогнозировать изменение тенденции
Таймфреймы М5 и М15 могут иметь больше ложных точек входа.
Открыть график инструмента в новом окне


