

Actual patterns

Patterns are graphical models which are formed in the chart by the price. According to one of the technical analysis postulates, history (price movement) repeats itself. It means that the price movements are often similar in the same situations which makes it possible to predict the further development of the situation with a high probability.
Relevant patterns by InstaTrade is an easy-to-use service which allows you to be aware of latest changes in the market and react to clues from the market in time. In our service you will always find the latest and most relevant patterns on any pair and any timeframe.
Triple Top
was formed on 24.03 at 23:01:00 (UTC+0)
signal strength 1 of 5

The Triple Top pattern has formed on the chart of the EURJPY M5. Features of the pattern: borders have an ascending angle; the lower line of the pattern has the coordinates 162.59/162.72 with the upper limit 162.78/162.77; the projection of the width is 19 points. The formation of the Triple Top figure most likely indicates a change in the trend from upward to downward. This means that in the event of a breakdown of the support level of 162.59, the price is most likely to continue the downward movement.
The M5 and M15 time frames may have more false entry points.
See Also
- All
- All
- Bearish Rectangle
- Bearish Symmetrical Triangle
- Bearish Symmetrical Triangle
- Bullish Rectangle
- Double Top
- Double Top
- Triple Bottom
- Triple Bottom
- Triple Top
- Triple Top
- All
- All
- Buy
- Sale
- All
- 1
- 2
- 3
- 4
- 5
Persegi Bullish
was formed on 02.05 at 16:26:31 (UTC+0)
signal strength 1 of 5
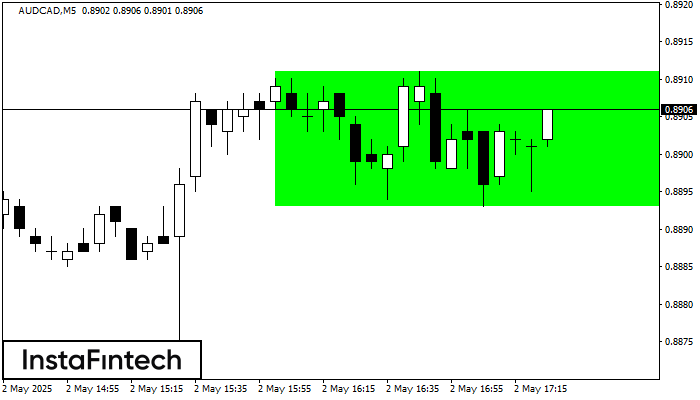
Menurut grafik dari M5, AUDCAD terbentuk Persegi Bullish. Jenis pola ini menunjukkan kelanjutan tren. Terdiri dari dua tingkat: resistance 0.8911 dan support 0.8893. Jika level resistance 0.8911 - 0.8911 ditembus
Rangka waktu M5 dan M15 mungkin memiliki lebih dari titik entri yang keliru.
Open chart in a new window
Teratas Ganda
was formed on 02.05 at 16:05:28 (UTC+0)
signal strength 1 of 5
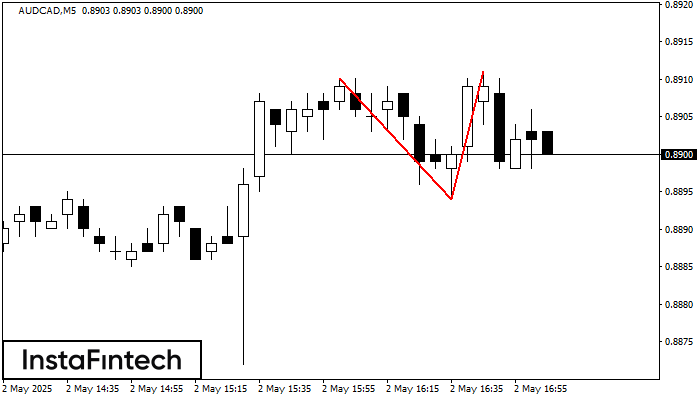
Pada grafik AUDCAD M5 pola reversal Teratas Ganda telah terbentuk. Karakteristik: batas atas 0.8911; batas bawah 0.8894; lebar pola 17 poin. Sinyal: tembusan ke batas bawah akan menyebabkan kelanjutan tren
Rangka waktu M5 dan M15 mungkin memiliki lebih dari titik entri yang keliru.
Open chart in a new window
Kepala dan bahu
was formed on 02.05 at 15:40:20 (UTC+0)
signal strength 1 of 5
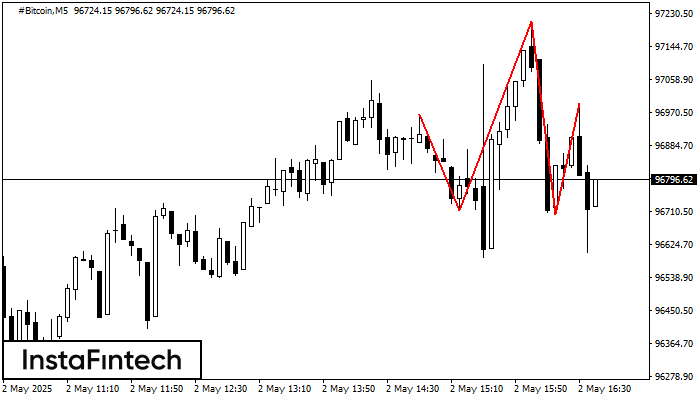
Pola teknikal yang disebut Kepala dan bahu telah muncul pada grafik #Bitcoin M5. Terdapat banyak alasan untuk harga melewati Neckline 96714.23/96704.41 setelah Shoulder kanan terbentuk. Jadi, tren akan berubah dengan
Rangka waktu M5 dan M15 mungkin memiliki lebih dari titik entri yang keliru.
Open chart in a new window


