

Actual patterns

Patterns are graphical models which are formed in the chart by the price. According to one of the technical analysis postulates, history (price movement) repeats itself. It means that the price movements are often similar in the same situations which makes it possible to predict the further development of the situation with a high probability.
Relevant patterns by InstaTrade is an easy-to-use service which allows you to be aware of latest changes in the market and react to clues from the market in time. In our service you will always find the latest and most relevant patterns on any pair and any timeframe.
Double Top
was formed on 24.03 at 03:25:45 (UTC+0)
signal strength 1 of 5
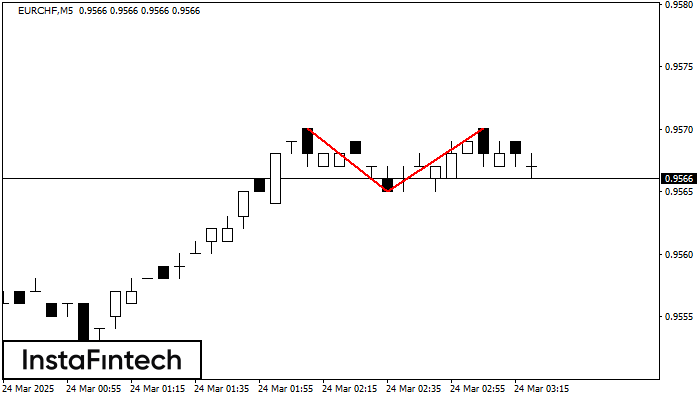
On the chart of EURCHF M5 the Double Top reversal pattern has been formed. Characteristics: the upper boundary 0.9570; the lower boundary 0.9565; the width of the pattern 5 points. The signal: a break of the lower boundary will cause continuation of the downward trend targeting the 0.9550 level.
The M5 and M15 time frames may have more false entry points.
- All
- All
- Bearish Rectangle
- Bearish Symmetrical Triangle
- Bearish Symmetrical Triangle
- Bullish Rectangle
- Double Top
- Double Top
- Triple Bottom
- Triple Bottom
- Triple Top
- Triple Top
- All
- All
- Buy
- Sale
- All
- 1
- 2
- 3
- 4
- 5
Persegi Bearish
was formed on 02.05 at 07:29:15 (UTC+0)
signal strength 1 of 5
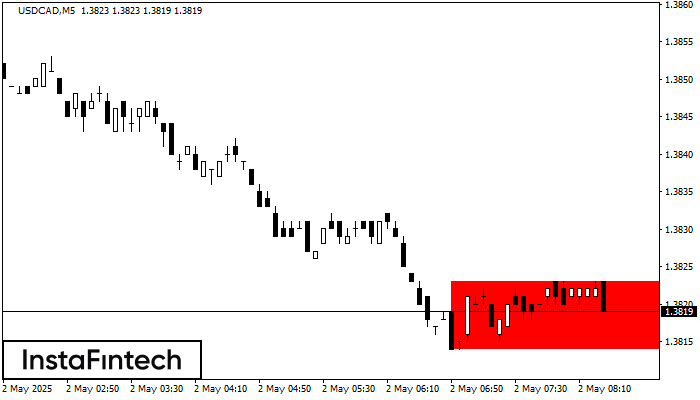
Menurut grafik dari M5, USDCAD terbentuk Persegi Bearish yang merupakan pola dari kelanjutan tren. Pola terkandung di dalam batas berikut: batas lebih rendah 1.3814 – 1.3814 dan batas atas 1.3823
Rangka waktu M5 dan M15 mungkin memiliki lebih dari titik entri yang keliru.
Open chart in a new window
Segitiga Simetris Bearish
was formed on 02.05 at 06:54:22 (UTC+0)
signal strength 1 of 5
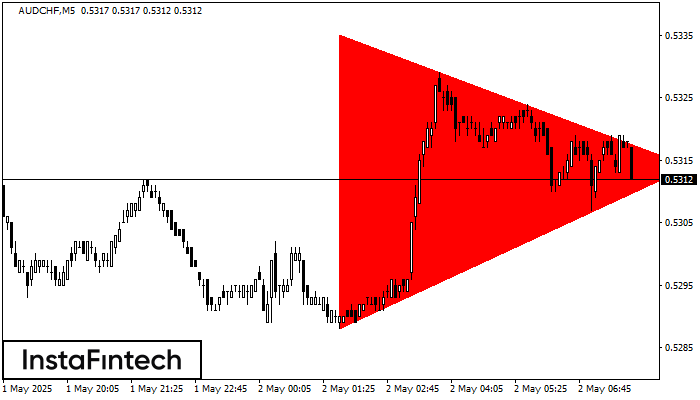
Menurut Grafik dari M5, AUDCHF dibentuk pola Segitiga Simetris Bearish. Rekomendasi Trading: Penembusan dari batas yang lebih rendah 0.5288 kemungkinan akan mendorong kelanjutan dari tren penurunan
Rangka waktu M5 dan M15 mungkin memiliki lebih dari titik entri yang keliru.
Open chart in a new window
Teratas Ganda
was formed on 02.05 at 06:30:42 (UTC+0)
signal strength 3 of 5
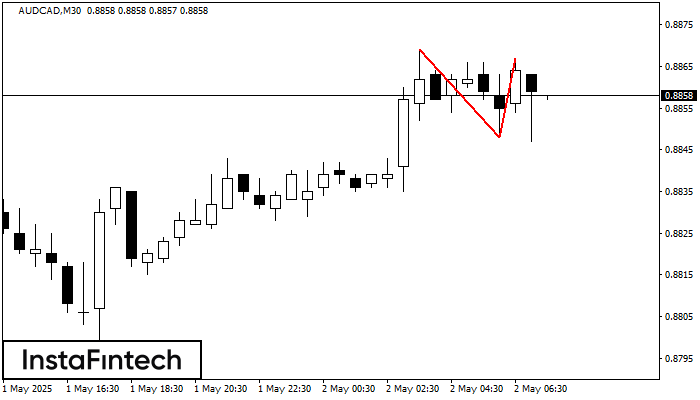
Pola Teratas Ganda telah terbentuk pada AUDCAD M30. Pola ini menandakan bahwa tren telah berubah dari kenaikan menjadi penurunan. Mungkin, jika dasar pola di 0.8848 ditembus, maka pergerakan menurun akan
Open chart in a new window


