

Actual patterns

Patterns are graphical models which are formed in the chart by the price. According to one of the technical analysis postulates, history (price movement) repeats itself. It means that the price movements are often similar in the same situations which makes it possible to predict the further development of the situation with a high probability.
Relevant patterns by InstaTrade is an easy-to-use service which allows you to be aware of latest changes in the market and react to clues from the market in time. In our service you will always find the latest and most relevant patterns on any pair and any timeframe.
Bullish Symmetrical Triangle
was formed on 21.03 at 04:06:31 (UTC+0)
signal strength 1 of 5
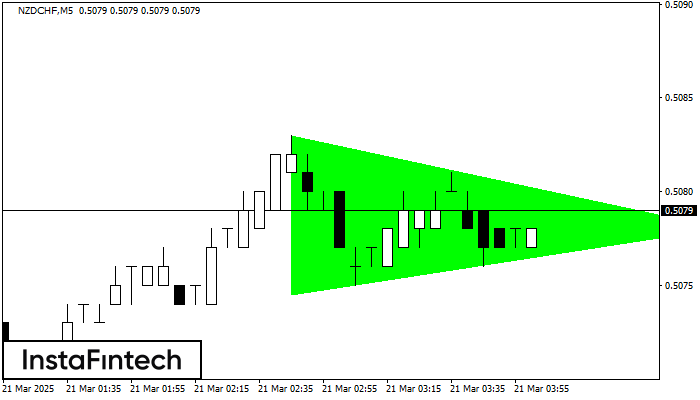
According to the chart of M5, NZDCHF formed the Bullish Symmetrical Triangle pattern. Description: This is the pattern of a trend continuation. 0.5083 and 0.5075 are the coordinates of the upper and lower borders respectively. The pattern width is measured on the chart at 8 pips. Outlook: If the upper border 0.5083 is broken, the price is likely to continue its move by 0.5093.
The M5 and M15 time frames may have more false entry points.
- All
- All
- Bearish Rectangle
- Bearish Symmetrical Triangle
- Bearish Symmetrical Triangle
- Bullish Rectangle
- Double Top
- Double Top
- Triple Bottom
- Triple Bottom
- Triple Top
- Triple Top
- All
- All
- Buy
- Sale
- All
- 1
- 2
- 3
- 4
- 5
Panji Bearish
was formed on 02.05 at 14:58:14 (UTC+0)
signal strength 1 of 5
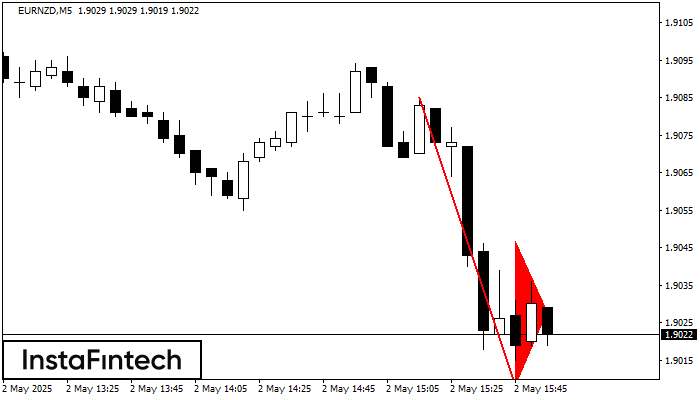
Pola Panji Bearish telah terbentuk di grafik EURNZD M5. Pola ini memberikan sinyal potensi kelanjutan tren yang ada. Spesifikasi: titik terendah pola berkoordinat di 1.9008; proyeksi titik tertinggi sama dengan
Rangka waktu M5 dan M15 mungkin memiliki lebih dari titik entri yang keliru.
Open chart in a new window
Teratas Ganda
was formed on 02.05 at 14:30:24 (UTC+0)
signal strength 1 of 5
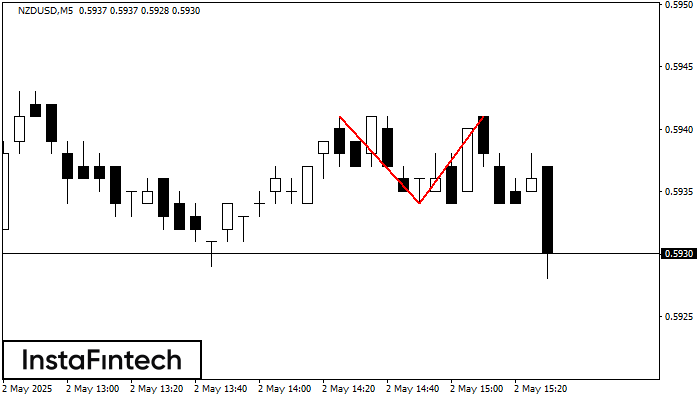
Pada grafik NZDUSD M5 pola reversal Teratas Ganda telah terbentuk. Karakteristik: batas atas 0.5941; batas bawah 0.5934; lebar pola 7 poin. Sinyal: tembusan ke batas bawah akan menyebabkan kelanjutan tren
Rangka waktu M5 dan M15 mungkin memiliki lebih dari titik entri yang keliru.
Open chart in a new window
Bawah Ganda
was formed on 02.05 at 14:30:14 (UTC+0)
signal strength 2 of 5
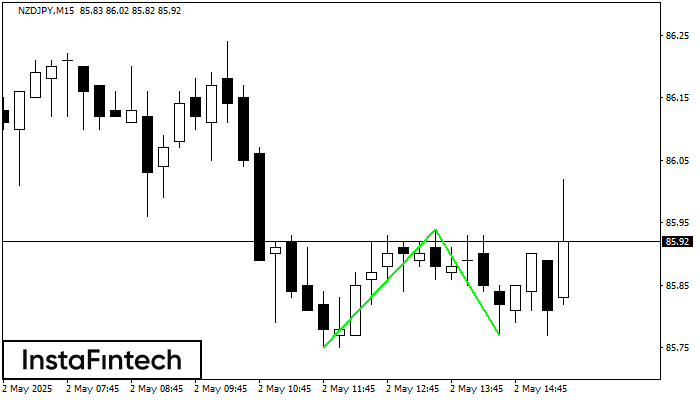
Pola Bawah Ganda telah terbentuk pada NZDJPY M15. Formasi ini mensinyalkan reversal tren dari arah penurunan ke arah kenaikan. Sinyal menunjukkan bahwa transaksi beli harus dibuka setelah batas atas pola
Rangka waktu M5 dan M15 mungkin memiliki lebih dari titik entri yang keliru.
Open chart in a new window


