

Actual patterns

Patterns are graphical models which are formed in the chart by the price. According to one of the technical analysis postulates, history (price movement) repeats itself. It means that the price movements are often similar in the same situations which makes it possible to predict the further development of the situation with a high probability.
Relevant patterns by InstaTrade is an easy-to-use service which allows you to be aware of latest changes in the market and react to clues from the market in time. In our service you will always find the latest and most relevant patterns on any pair and any timeframe.
Double Bottom
was formed on 21.03 at 03:15:41 (UTC+0)
signal strength 2 of 5
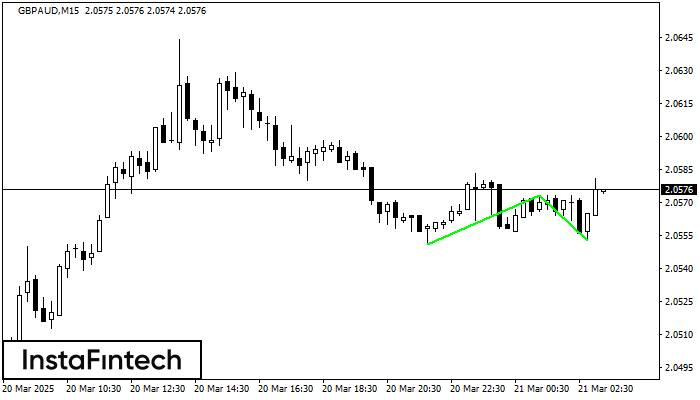
The Double Bottom pattern has been formed on GBPAUD M15; the upper boundary is 2.0573; the lower boundary is 2.0553. The width of the pattern is 22 points. In case of a break of the upper boundary 2.0573, a change in the trend can be predicted where the width of the pattern will coincide with the distance to a possible take profit level.
The M5 and M15 time frames may have more false entry points.
See Also
- All
- All
- Bearish Rectangle
- Bearish Symmetrical Triangle
- Bearish Symmetrical Triangle
- Bullish Rectangle
- Double Top
- Double Top
- Triple Bottom
- Triple Bottom
- Triple Top
- Triple Top
- All
- All
- Buy
- Sale
- All
- 1
- 2
- 3
- 4
- 5
Teratas Ganda
was formed on 02.05 at 19:05:29 (UTC+0)
signal strength 1 of 5
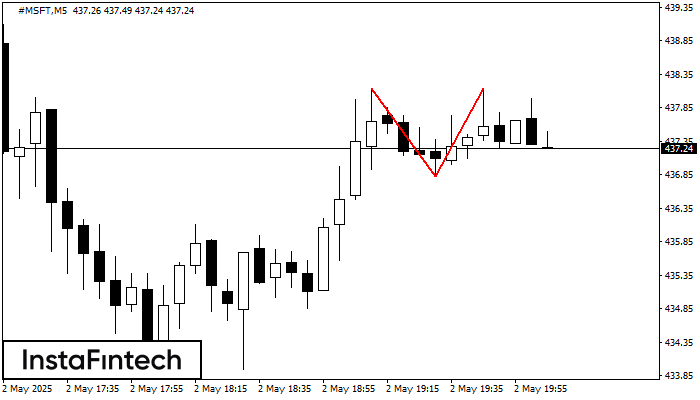
Pola Teratas Ganda telah terbentuk pada #MSFT M5. Pola ini menandakan bahwa tren telah berubah dari kenaikan menjadi penurunan. Mungkin, jika dasar pola di 436.83 ditembus, maka pergerakan menurun akan
Rangka waktu M5 dan M15 mungkin memiliki lebih dari titik entri yang keliru.
Open chart in a new window
Panji Bullish
was formed on 02.05 at 18:30:27 (UTC+0)
signal strength 4 of 5
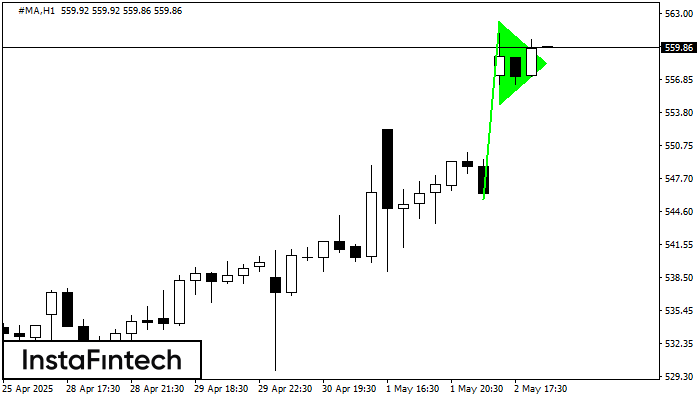
Pola grafik Panji Bullish telah terbentuk di instrumen #MA H1. Jenis pola ini terjadi pada kategori pola kelanjutan. Dalam kasus ini, jika kuotasi dapat menembus titik tertinggi, harga diperkirakan akan
Open chart in a new window
Persegi Bullish
was formed on 02.05 at 18:06:10 (UTC+0)
signal strength 1 of 5
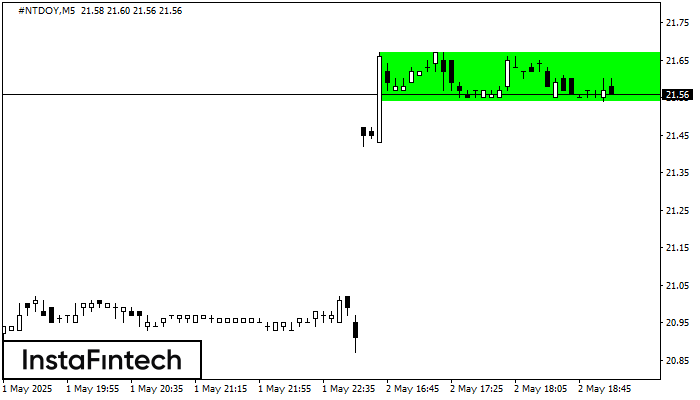
Menurut grafik dari M5, #NTDOY terbentuk Persegi Bullish. Pola menunjukkan kelanjutan tren. Batas atas adalah 21.67, batas lebih rendah adalah 21.54. Sinyal berarti posisi beli harus dibuka diatas batas atas
Rangka waktu M5 dan M15 mungkin memiliki lebih dari titik entri yang keliru.
Open chart in a new window


