

实际模式

模式是通过价格在图表中形成的图形模型。 根据其中一项技术分析规定,历史(价格变动)重演。 这意味着价格变动在相同的情况下通常是相似的,这使得有可能以高概率预测情况的进一步发展。
InstaTrade的相关模式是一款易于使用的服务,可让您了解市场的最新变化并及时对市场线索做出反应。 在我们的服务中,您始终可以在任何货币对以及任何时间范围内找到最新和最相关的模式。
Bearish Flag
was formed on 16.04 at 00:23:57 (UTC+0)
signal strength 1 of 5

The Bearish Flag pattern has been formed on the chart AUDCAD M5. Therefore, the downwards trend is likely to continue in the nearest term. As soon as the price breaks below the low at 0.8835, traders should enter the market.
The M5 and M15 time frames may have more false entry points.
- All
- All
- Bearish Rectangle
- Bearish Symmetrical Triangle
- Bearish Symmetrical Triangle
- Bullish Rectangle
- Double Top
- Double Top
- Triple Bottom
- Triple Bottom
- Triple Top
- Triple Top
- All
- All
- Buy
- Sale
- All
- 1
- 2
- 3
- 4
- 5
Topo triplo
was formed on 14.05 at 12:50:24 (UTC+0)
signal strength 1 of 5
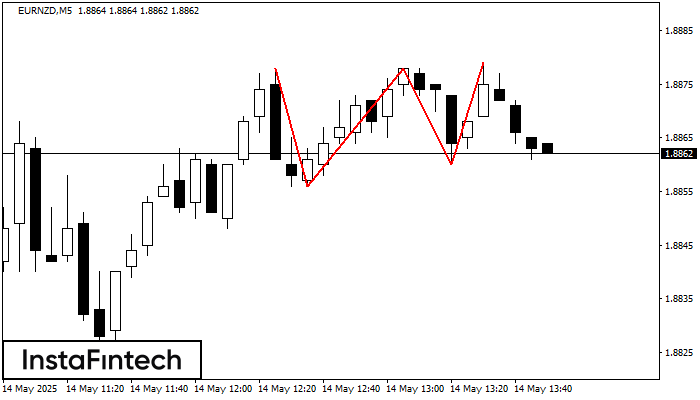
O padrão Topo triplo foi formado no gráfico do instrumento de negociação EURNZD M5. É um padrão de reversão com as seguintes características: nível de resistência -1, nível de suporte
Os intervalos M5 e M15 podem ter mais pontos de entrada falsos.
Open chart in a new window
Pennant de baixa
was formed on 14.05 at 12:38:21 (UTC+0)
signal strength 2 of 5
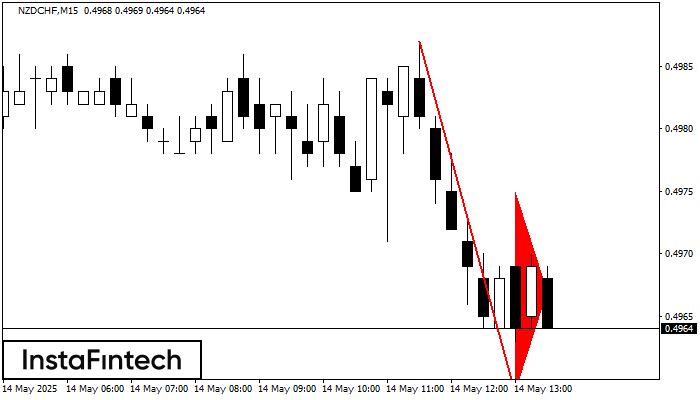
O padrão Pennant de baixa foi formado no gráfico NZDCHF M15. Este tipo de padrão é caracterizado por uma ligeira desaceleração após a qual o preço se moverá na direção
Os intervalos M5 e M15 podem ter mais pontos de entrada falsos.
Open chart in a new window
Retângulo de baixa
was formed on 14.05 at 12:38:19 (UTC+0)
signal strength 1 of 5
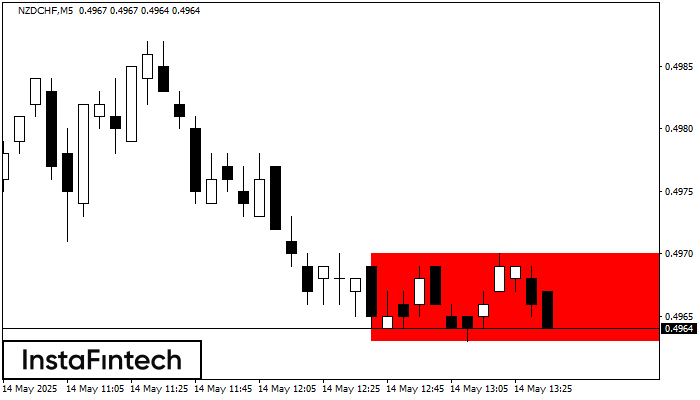
De acordo com o gráfico de M5, NZDCHF formou Retângulo de baixa. Este tipo de padrão indica uma continuação da tendência. Ele consiste em dois níveis: resistência 0.4970 – 0.0000
Os intervalos M5 e M15 podem ter mais pontos de entrada falsos.
Open chart in a new window


