

实际模式

模式是通过价格在图表中形成的图形模型。 根据其中一项技术分析规定,历史(价格变动)重演。 这意味着价格变动在相同的情况下通常是相似的,这使得有可能以高概率预测情况的进一步发展。
InstaTrade的相关模式是一款易于使用的服务,可让您了解市场的最新变化并及时对市场线索做出反应。 在我们的服务中,您始终可以在任何货币对以及任何时间范围内找到最新和最相关的模式。
Bearish pennant
was formed on 04.04 at 18:00:25 (UTC+0)
signal strength 2 of 5
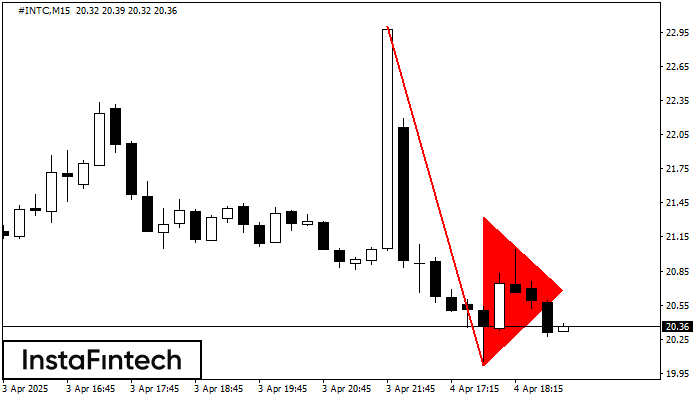
The Bearish pennant pattern has formed on the #INTC M15 chart. This pattern type is characterized by a slight slowdown after which the price will move in the direction of the original trend. In case the price fixes below the pattern’s low of 20.02, a trader will be able to successfully enter the sell position.
The M5 and M15 time frames may have more false entry points.
- All
- All
- Bearish Rectangle
- Bearish Symmetrical Triangle
- Bearish Symmetrical Triangle
- Bullish Rectangle
- Double Top
- Double Top
- Triple Bottom
- Triple Bottom
- Triple Top
- Triple Top
- All
- All
- Buy
- Sale
- All
- 1
- 2
- 3
- 4
- 5
รูปแบบกราฟจุดสามยอดขาลง (Triple Bottom)
was formed on 17.05 at 17:00:17 (UTC+0)
signal strength 3 of 5

รูปแบบ รูปแบบกราฟจุดสามยอดขาลง (Triple Bottom) ได้ถูกสร้างขึ้นมาใน #Bitcoin M30 มันมี คุณลักษณะ ดังต่อไปนี้: ระดับแนวต้าน 103658.13/103057.03; ระดับของแนวรับ 102549.85/102590.27; ความกว้างคือ
Open chart in a new window
รูปแบบกราฟหัวและหัวไหล่แบบกลับหัว (Inverse Head and Shoulder)
was formed on 17.05 at 05:40:01 (UTC+0)
signal strength 1 of 5

อ้างอิงจากชาร์ตของ M5, #Bitcoin ที่ได้สร้างรูปแบบตาม รูปแบบกราฟหัวและหัวไหล่แบบกลับหัว (Inverse Head and Shoulder) ตำแหน่งของหัวอยู่ใน 102549.85 ระหว่างนั้นเส้นระดับกลางของตำแหน่งคอ อยู่ในระดับที่ 103359.60/103319.80 การก่อตัวของรูปแบบ
ขอบเตระยะเวลาใน M5 และ M15 อาจจะมีตำแหน่งการเข้าใช้งานที่ผิดพลาดมากยิ่งขึ้น
Open chart in a new window
รูปแบบกราฟจุดสองยอดขาลง (Double Bottom)
was formed on 17.05 at 02:15:26 (UTC+0)
signal strength 1 of 5

รูปแบบ รูปแบบกราฟจุดสองยอดขาลง (Double Bottom) ถูกสร้างขึ้นมาใน #Bitcoin M5; ขอบเขตด้านบนอยู่ที่ 103642.04;ขอบเขตด้านล่าง คือ 103357.83 ความกว้างของรูปแบบนี้คือ 27887 จุด กรณีที่มีการเคลื่อนตัวทะลุผ่านขอบเขตด้านบน
ขอบเตระยะเวลาใน M5 และ M15 อาจจะมีตำแหน่งการเข้าใช้งานที่ผิดพลาดมากยิ่งขึ้น
Open chart in a new window


