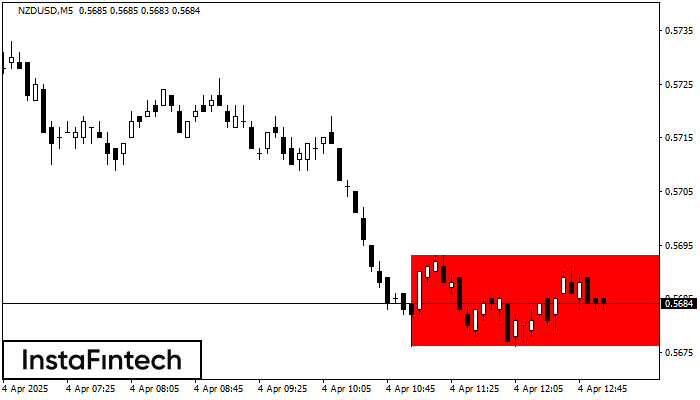
Bearish Rectangle
was formed on 04.04 at 12:01:29 (UTC+0)
signal strength 1 of 5

According to the chart of M5, NZDUSD formed the Bearish Rectangle which is a pattern of a trend continuation. The pattern is contained within the following borders: lower border 0.5676 – 0.5676 and upper border 0.5693 – 0.5693. In case the lower border is broken, the instrument is likely to follow the downward trend.
The M5 and M15 time frames may have more false entry points.
- All
- All
- Bearish Rectangle
- Bearish Symmetrical Triangle
- Bearish Symmetrical Triangle
- Bullish Rectangle
- Double Top
- Double Top
- Triple Bottom
- Triple Bottom
- Triple Top
- Triple Top
- All
- All
- Buy
- Sale
- All
- 1
- 2
- 3
- 4
- 5
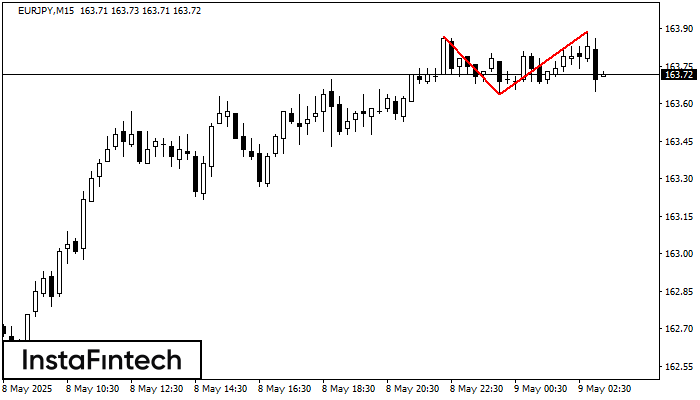
Double Top
was formed on 09.05 at 02:15:13 (UTC+0)
signal strength 2 of 5
Pada carta EURJPY M15 corak pembalikan Double Top telah terbentuk. Ciri-ciri: sempadan atas 163.89; sempadan bawah 163.64; lebar corak 25 mata. Isyarat: penembusan sempadan bawah akan menyebabkan kesinambungan arah aliran
Carta masa M5 dan M15 mungkin mempunyai lebih banyak titik kemasukan palsu.
Open chart in a new window
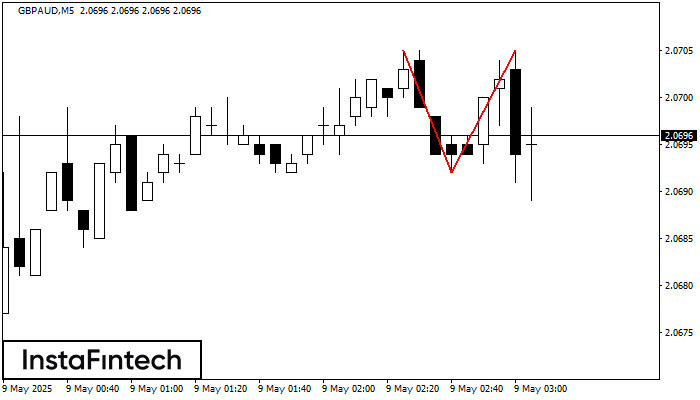
Double Top
was formed on 09.05 at 02:09:54 (UTC+0)
signal strength 1 of 5
Pada carta GBPAUD M5 corak pembalikan Double Top telah terbentuk. Ciri-ciri: sempadan atas 2.0705; sempadan bawah 2.0692; lebar corak 13 mata. Isyarat: penembusan sempadan bawah akan menyebabkan kesinambungan arah aliran
Carta masa M5 dan M15 mungkin mempunyai lebih banyak titik kemasukan palsu.
Open chart in a new window
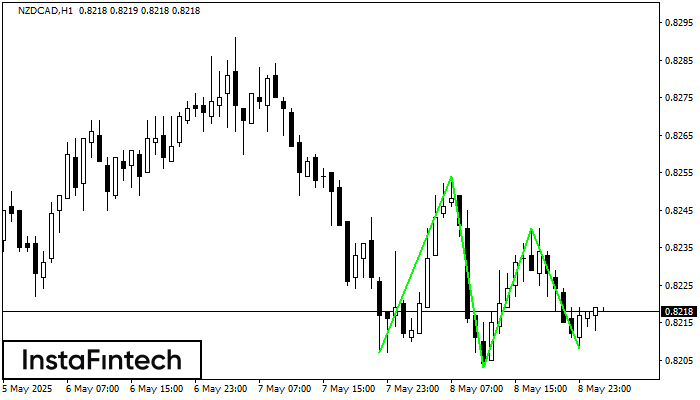
Triple Bottom
was formed on 09.05 at 01:00:28 (UTC+0)
signal strength 4 of 5
Corak Triple Bottom telah dibentuk pada carta NZDCAD H1. Ciri-ciri corak: Garisan bawah corak mempunyai koordinat 0.8254 dengan had atas 0.8254/0.8240, unjuran lebar adalah 47 mata. Pembentukan corak Triple Bottom
Open chart in a new window


