

实际模式

模式是通过价格在图表中形成的图形模型。 根据其中一项技术分析规定,历史(价格变动)重演。 这意味着价格变动在相同的情况下通常是相似的,这使得有可能以高概率预测情况的进一步发展。
InstaTrade的相关模式是一款易于使用的服务,可让您了解市场的最新变化并及时对市场线索做出反应。 在我们的服务中,您始终可以在任何货币对以及任何时间范围内找到最新和最相关的模式。
Triple Top
was formed on 31.03 at 10:00:28 (UTC+0)
signal strength 3 of 5

On the chart of the EURUSD M30 trading instrument, the Triple Top pattern that signals a trend change has formed. It is possible that after formation of the third peak, the price will try to break through the resistance level 1.0805, where we advise to open a trading position for sale. Take profit is the projection of the pattern’s width, which is 39 points.
- All
- All
- Bearish Rectangle
- Bearish Symmetrical Triangle
- Bearish Symmetrical Triangle
- Bullish Rectangle
- Double Top
- Double Top
- Triple Bottom
- Triple Bottom
- Triple Top
- Triple Top
- All
- All
- Buy
- Sale
- All
- 1
- 2
- 3
- 4
- 5
Bearish Flag
was formed on 10.04 at 20:47:53 (UTC+0)
signal strength 1 of 5
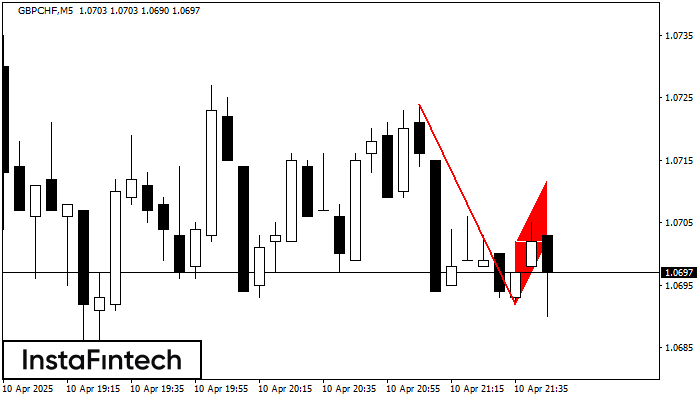
The Bearish Flag pattern has been formed on the chart GBPCHF M5. Therefore, the downwards trend is likely to continue in the nearest term. As soon as the price breaks
The M5 and M15 time frames may have more false entry points.
Open chart in a new window
Bearish pennant
was formed on 10.04 at 20:47:47 (UTC+0)
signal strength 1 of 5
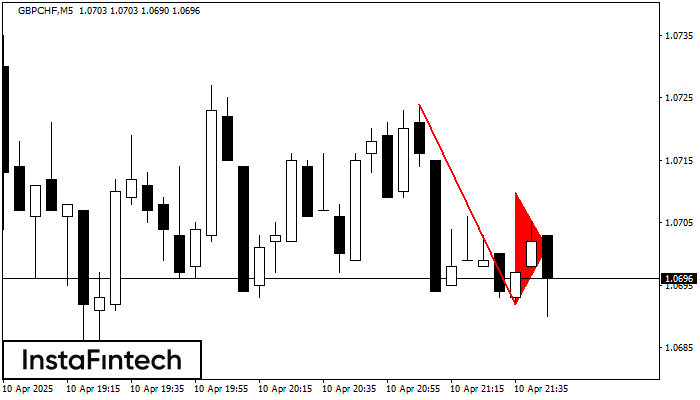
The Bearish pennant pattern has formed on the GBPCHF M5 chart. It signals potential continuation of the existing trend. Specifications: the pattern’s bottom has the coordinate of 1.0692; the projection
The M5 and M15 time frames may have more false entry points.
Open chart in a new window
Bearish Rectangle
was formed on 10.04 at 20:15:38 (UTC+0)
signal strength 1 of 5
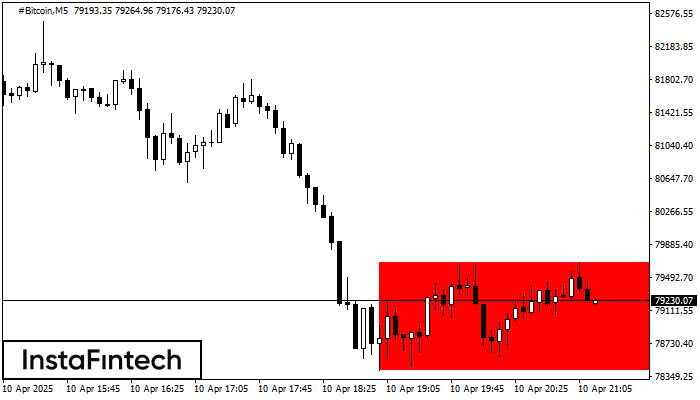
According to the chart of M5, #Bitcoin formed the Bearish Rectangle. The pattern indicates a trend continuation. The upper border is 79670.12, the lower border is 78416.24. The signal means
The M5 and M15 time frames may have more false entry points.
Open chart in a new window


