

实际模式

模式是通过价格在图表中形成的图形模型。 根据其中一项技术分析规定,历史(价格变动)重演。 这意味着价格变动在相同的情况下通常是相似的,这使得有可能以高概率预测情况的进一步发展。
InstaTrade的相关模式是一款易于使用的服务,可让您了解市场的最新变化并及时对市场线索做出反应。 在我们的服务中,您始终可以在任何货币对以及任何时间范围内找到最新和最相关的模式。
Double Bottom
was formed on 30.03 at 23:00:31 (UTC+0)
signal strength 3 of 5
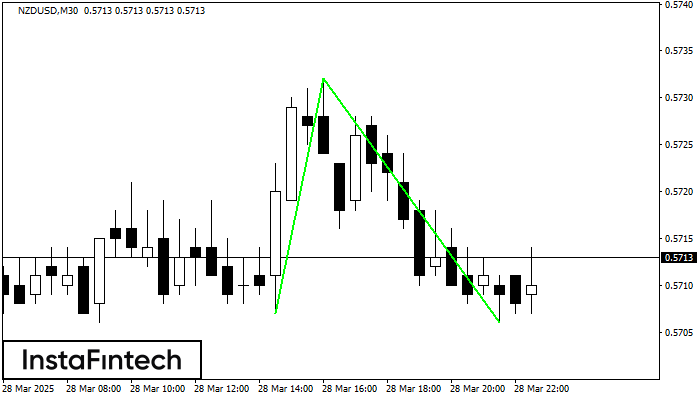
The Double Bottom pattern has been formed on NZDUSD M30. This formation signals a reversal of the trend from downwards to upwards. The signal is that a buy trade should be opened after the upper boundary of the pattern 0.5732 is broken. The further movements will rely on the width of the current pattern 25 points.
- All
- All
- Bearish Rectangle
- Bearish Symmetrical Triangle
- Bearish Symmetrical Triangle
- Bullish Rectangle
- Double Top
- Double Top
- Triple Bottom
- Triple Bottom
- Triple Top
- Triple Top
- All
- All
- Buy
- Sale
- All
- 1
- 2
- 3
- 4
- 5
Bawah Ganda
was formed on 08.05 at 03:00:09 (UTC+0)
signal strength 1 of 5
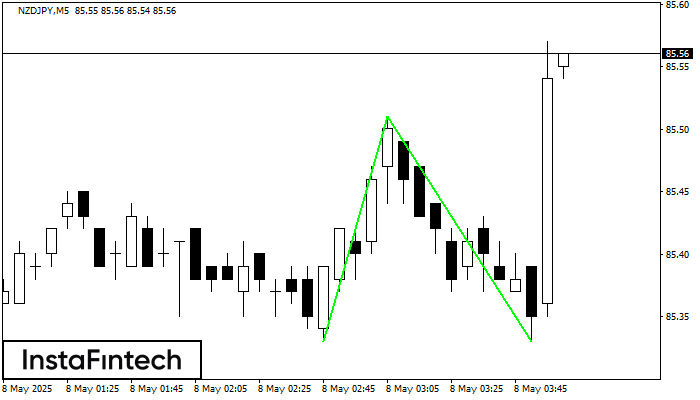
Pola Bawah Ganda telah terbentuk pada NZDJPY M5. Karakteristik: level support 85.33; level resistance 85.51; lebar pola 18 poin. Jika level resistance ditembus, perubahan dalam tren dapat diprediksi dengan target
Rangka waktu M5 dan M15 mungkin memiliki lebih dari titik entri yang keliru.
Open chart in a new window
Teratas Ganda
was formed on 08.05 at 02:56:23 (UTC+0)
signal strength 1 of 5
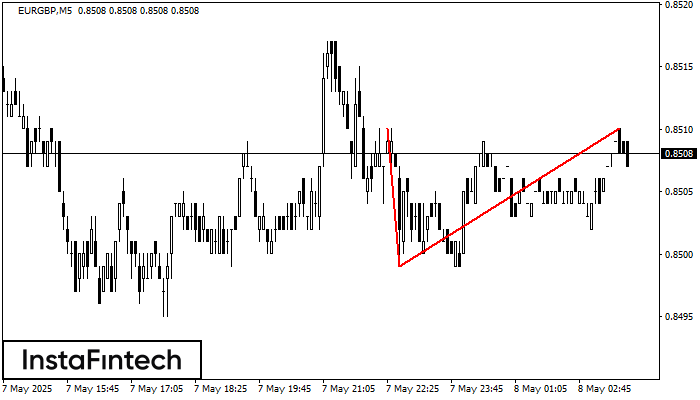
Pola Teratas Ganda telah terbentuk pada EURGBP M5. Pola ini menandakan bahwa tren telah berubah dari kenaikan menjadi penurunan. Mungkin, jika dasar pola di 0.8499 ditembus, maka pergerakan menurun akan
Rangka waktu M5 dan M15 mungkin memiliki lebih dari titik entri yang keliru.
Open chart in a new window
Bawah Ganda
was formed on 08.05 at 02:01:06 (UTC+0)
signal strength 2 of 5
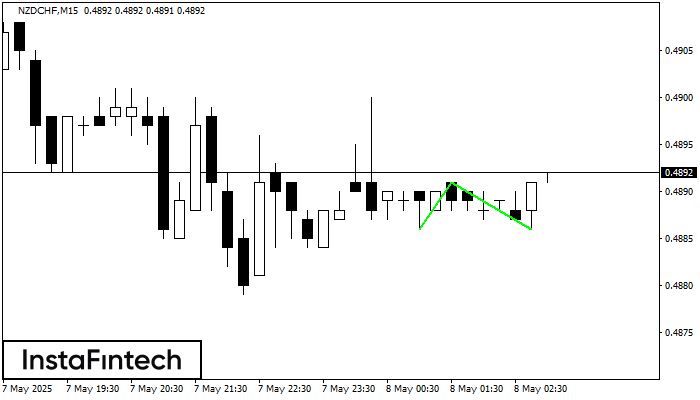
Pola Bawah Ganda telah terbentuk pada NZDCHF M15. Formasi ini mensinyalkan reversal tren dari arah penurunan ke arah kenaikan. Sinyal menunjukkan bahwa transaksi beli harus dibuka setelah batas atas pola
Rangka waktu M5 dan M15 mungkin memiliki lebih dari titik entri yang keliru.
Open chart in a new window


