

实际模式

模式是通过价格在图表中形成的图形模型。 根据其中一项技术分析规定,历史(价格变动)重演。 这意味着价格变动在相同的情况下通常是相似的,这使得有可能以高概率预测情况的进一步发展。
InstaTrade的相关模式是一款易于使用的服务,可让您了解市场的最新变化并及时对市场线索做出反应。 在我们的服务中,您始终可以在任何货币对以及任何时间范围内找到最新和最相关的模式。
Bearish Symmetrical Triangle
was formed on 28.03 at 19:23:04 (UTC+0)
signal strength 4 of 5
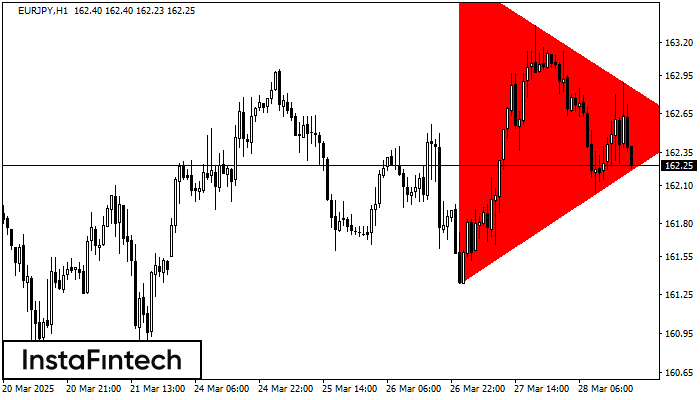
According to the chart of H1, EURJPY formed the Bearish Symmetrical Triangle pattern. This pattern signals a further downward trend in case the lower border 161.34 is breached. Here, a hypothetical profit will equal the width of the available pattern that is -237 pips.
See Also
- All
- All
- Bearish Rectangle
- Bearish Symmetrical Triangle
- Bearish Symmetrical Triangle
- Bullish Rectangle
- Double Top
- Double Top
- Triple Bottom
- Triple Bottom
- Triple Top
- Triple Top
- All
- All
- Buy
- Sale
- All
- 1
- 2
- 3
- 4
- 5
Retângulo de alta
was formed on 12.05 at 17:30:19 (UTC+0)
signal strength 1 of 5
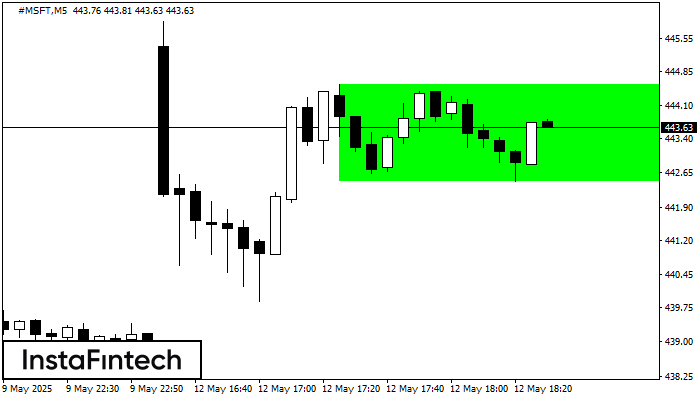
De acordo com o gráfico de M5, #MSFT formou Retângulo de alta. O padrão indica uma continuação da tendência. O limite superior é 444.56, o limite inferior é 442.46
Os intervalos M5 e M15 podem ter mais pontos de entrada falsos.
Open chart in a new window
Bandeira de Alta
was formed on 12.05 at 17:30:16 (UTC+0)
signal strength 1 of 5
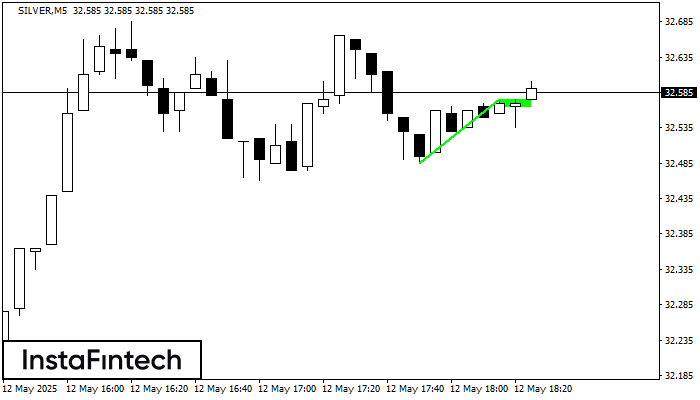
O padrão Bandeira de Alta foi formado no gráfico SILVER M5, o que sinaliza que a tendência ascendente continuará. Sinais: uma quebra do pico em 32.58 pode empurrar o preço
Os intervalos M5 e M15 podem ter mais pontos de entrada falsos.
Open chart in a new window
Retângulo de alta
was formed on 12.05 at 17:26:44 (UTC+0)
signal strength 1 of 5
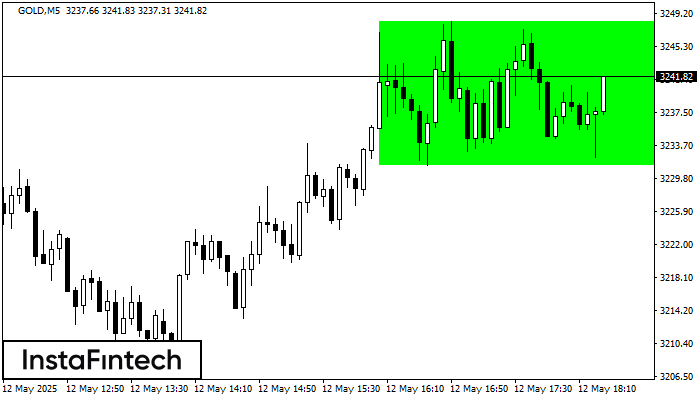
De acordo com o gráfico de M5, GOLD formou o Retângulo de alta que é um padrão de uma continuação da tendência. O padrão está dentro dos seguintes limites
Os intervalos M5 e M15 podem ter mais pontos de entrada falsos.
Open chart in a new window


