

Actual patterns

Patterns are graphical models which are formed in the chart by the price. According to one of the technical analysis postulates, history (price movement) repeats itself. It means that the price movements are often similar in the same situations which makes it possible to predict the further development of the situation with a high probability.
Relevant patterns by InstaTrade is an easy-to-use service which allows you to be aware of latest changes in the market and react to clues from the market in time. In our service you will always find the latest and most relevant patterns on any pair and any timeframe.
Bullish Rectangle
was formed on 02.04 at 06:48:50 (UTC+0)
signal strength 1 of 5
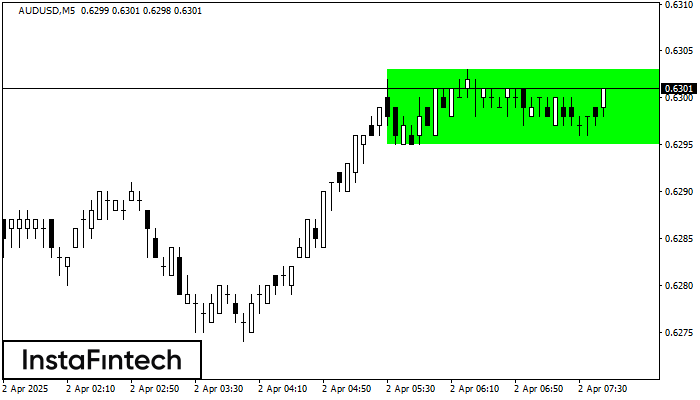
According to the chart of M5, AUDUSD formed the Bullish Rectangle. This type of a pattern indicates a trend continuation. It consists of two levels: resistance 0.6303 and support 0.6295. In case the resistance level 0.6303 - 0.6303 is broken, the instrument is likely to follow the bullish trend.
The M5 and M15 time frames may have more false entry points.
- All
- All
- Bearish Rectangle
- Bearish Symmetrical Triangle
- Bearish Symmetrical Triangle
- Bullish Rectangle
- Double Top
- Double Top
- Triple Bottom
- Triple Bottom
- Triple Top
- Triple Top
- All
- All
- Buy
- Sale
- All
- 1
- 2
- 3
- 4
- 5
Retângulo de alta
was formed on 26.05 at 03:20:39 (UTC+0)
signal strength 1 of 5
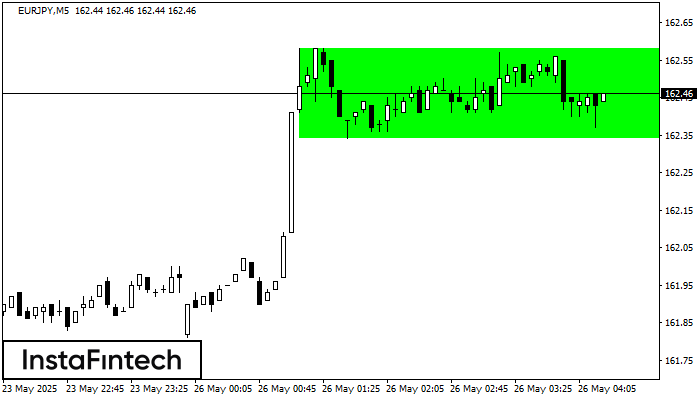
De acordo com o gráfico de M5, EURJPY formou o Retângulo de alta que é um padrão de uma continuação da tendência. O padrão está dentro dos seguintes limites
Os intervalos M5 e M15 podem ter mais pontos de entrada falsos.
Open chart in a new window
Fundo duplo
was formed on 26.05 at 03:00:31 (UTC+0)
signal strength 4 of 5
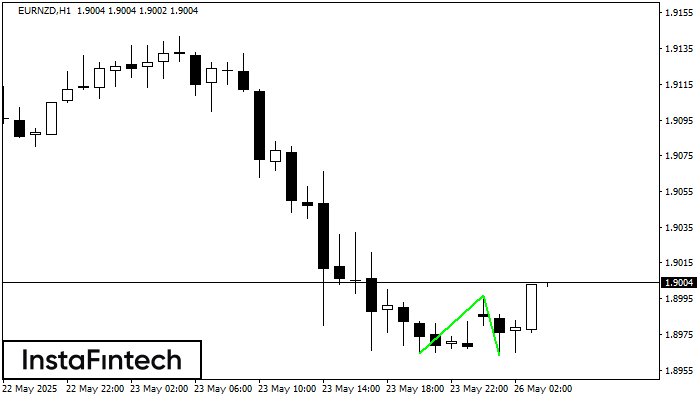
O padrão Fundo duplo foi formado em EURNZD H1. Esta formação sinaliza uma reversão da tendência de baixo para cima. O sinal é que uma negociação de compra deve
Open chart in a new window
Topo duplo
was formed on 26.05 at 03:00:31 (UTC+0)
signal strength 1 of 5
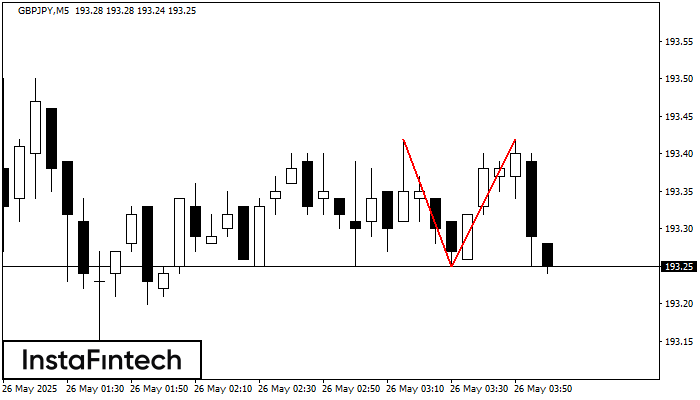
No gráfico de GBPJPY M5 o padrão de reversão Topo duplo foi formado. Características: o limite superior 193.42; o limite inferior 193.25; a largura do padrão 17 pontos. O sinal
Os intervalos M5 e M15 podem ter mais pontos de entrada falsos.
Open chart in a new window


