

Actual patterns

Patterns are graphical models which are formed in the chart by the price. According to one of the technical analysis postulates, history (price movement) repeats itself. It means that the price movements are often similar in the same situations which makes it possible to predict the further development of the situation with a high probability.
Relevant patterns by InstaTrade is an easy-to-use service which allows you to be aware of latest changes in the market and react to clues from the market in time. In our service you will always find the latest and most relevant patterns on any pair and any timeframe.
Bullish pennant
was formed on 28.03 at 01:00:44 (UTC+0)
signal strength 3 of 5
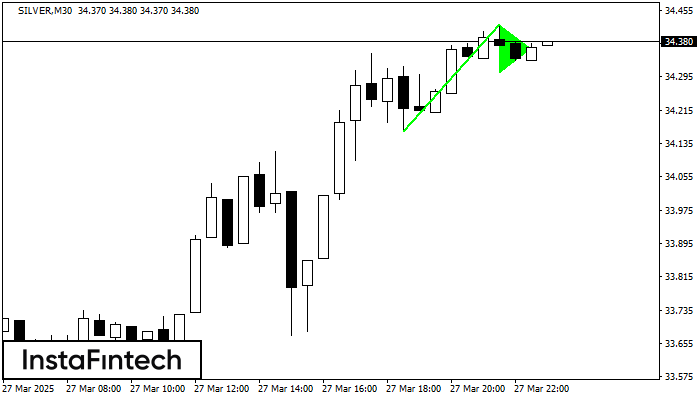
The Bullish pennant pattern is formed on the SILVER M30 chart. It is a type of the continuation pattern. Supposedly, in case the price is fixed above the pennant’s high of 34.42, a further uptrend is possible.
- All
- All
- Bearish Rectangle
- Bearish Symmetrical Triangle
- Bearish Symmetrical Triangle
- Bullish Rectangle
- Double Top
- Double Top
- Triple Bottom
- Triple Bottom
- Triple Top
- Triple Top
- All
- All
- Buy
- Sale
- All
- 1
- 2
- 3
- 4
- 5
Retângulo de baixa
was formed on 23.05 at 23:00:20 (UTC+0)
signal strength 1 of 5

De acordo com o gráfico de M5, EURNZD formou Retângulo de baixa. O padrão indica uma continuação da tendência. O limite superior é 1.8982, o limite inferior é 1.8964
Os intervalos M5 e M15 podem ter mais pontos de entrada falsos.
Open chart in a new window
Triângulo Simétrico de Alta
was formed on 23.05 at 22:14:53 (UTC+0)
signal strength 1 of 5

De acordo com o gráfico de M5, AUDCHF formaram o padrão de Triângulo Simétrico de Alta. Descrição: Este é o padrão de uma continuação de tendência. 0.5335 e 0.5329
Os intervalos M5 e M15 podem ter mais pontos de entrada falsos.
Open chart in a new window
Triângulo Simétrico de Alta
was formed on 23.05 at 22:10:58 (UTC+0)
signal strength 1 of 5

De acordo com o gráfico de M5, AUDJPY formaram o padrão de Triângulo Simétrico de Alta. Descrição: Este é o padrão de uma continuação de tendência. 92.60 e 92.44
Os intervalos M5 e M15 podem ter mais pontos de entrada falsos.
Open chart in a new window


