

অ্যাকচুয়াল প্যাটার্নস

প্যাটার্ন হলো গ্রাফিক্যাল মডেল, যা মূল্য ওঠানামার ভিত্তিতে চার্টে তৈরি হয়। টেকনিক্যাল বিশ্লেষণের নীতি অনুযায়ী, ইতিহাসের (প্রাইস মুভমেন্ট) পুনরাবৃত্তি ঘটে। অর্থাৎ, পরিস্থিতি যদি একই রকম থাকে তাহলে প্রাইস মুভমেন্টও প্রায় একই রকম হয়। এর ফলে মূল্যের ওঠানামা কেমন হবে তা আগেই থেকেই অনুমান করা যায়।
ইন্সটাফরেক্স এর প্রাসঙ্গিক প্যাটার্নসমূহ সহজেই ব্যবহার করা যায়, যার মাধ্যমে মার্কেটের সর্বশেষ পরিস্থিতি জানা যায় এবং তার উপর ভিত্তি করে সিদ্ধান্ত নেওয়া যায়। আমাদের সেবাগুলো থেকে আপনি যেকোনো পেয়ার এবং টাইমফ্রেমের জন্য সর্বশেষ এবং সবচেয়ে প্রাসঙ্গিক প্যাটার্নগুলো খুঁজে পাবেন।
Bearish Rectangle
was formed on 22.04 at 06:31:47 (UTC+0)
signal strength 1 of 5
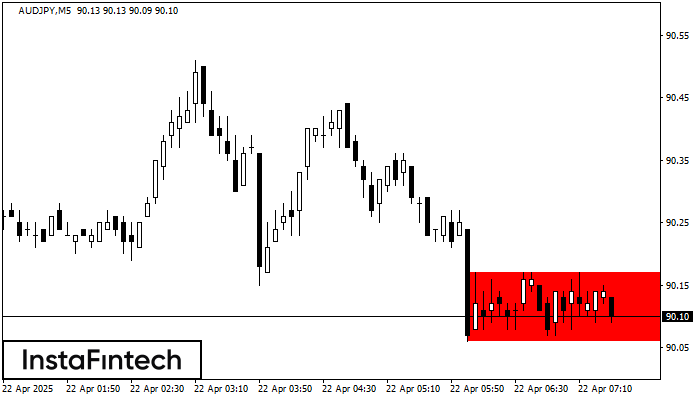
According to the chart of M5, AUDJPY formed the Bearish Rectangle. This type of a pattern indicates a trend continuation. It consists of two levels: resistance 90.17 - 0.00 and support 90.06 – 90.06. In case the resistance level 90.06 - 90.06 is broken, the instrument is likely to follow the bearish trend.
The M5 and M15 time frames may have more false entry points.
আরও দেখুন
- All
- All
- Bearish Rectangle
- Bearish Symmetrical Triangle
- Bearish Symmetrical Triangle
- Bullish Rectangle
- Double Top
- Double Top
- Triple Bottom
- Triple Bottom
- Triple Top
- Triple Top
- All
- All
- Buy
- Sale
- All
- 1
- 2
- 3
- 4
- 5
Double Bottom
was formed on 03.05 at 08:00:01 (UTC+0)
signal strength 3 of 5

The Double Bottom pattern has been formed on #Bitcoin M30; the upper boundary is 97860.25; the lower boundary is 96258.44. The width of the pattern is 156618 points. In case
Open chart in a new window
Double Bottom
was formed on 03.05 at 06:20:09 (UTC+0)
signal strength 1 of 5

The Double Bottom pattern has been formed on #Bitcoin M5; the upper boundary is 96467.62; the lower boundary is 96258.44. The width of the pattern is 20692 points. In case
The M5 and M15 time frames may have more false entry points.
Open chart in a new window
Triple Bottom
was formed on 02.05 at 22:50:22 (UTC+0)
signal strength 1 of 5

The Triple Bottom pattern has been formed on EURGBP M5. It has the following characteristics: resistance level 0.8515/0.8514; support level 0.8509/0.8509; the width is 6 points. In the event
The M5 and M15 time frames may have more false entry points.
Open chart in a new window


