

অ্যাকচুয়াল প্যাটার্নস

প্যাটার্ন হলো গ্রাফিক্যাল মডেল, যা মূল্য ওঠানামার ভিত্তিতে চার্টে তৈরি হয়। টেকনিক্যাল বিশ্লেষণের নীতি অনুযায়ী, ইতিহাসের (প্রাইস মুভমেন্ট) পুনরাবৃত্তি ঘটে। অর্থাৎ, পরিস্থিতি যদি একই রকম থাকে তাহলে প্রাইস মুভমেন্টও প্রায় একই রকম হয়। এর ফলে মূল্যের ওঠানামা কেমন হবে তা আগেই থেকেই অনুমান করা যায়।
ইন্সটাফরেক্স এর প্রাসঙ্গিক প্যাটার্নসমূহ সহজেই ব্যবহার করা যায়, যার মাধ্যমে মার্কেটের সর্বশেষ পরিস্থিতি জানা যায় এবং তার উপর ভিত্তি করে সিদ্ধান্ত নেওয়া যায়। আমাদের সেবাগুলো থেকে আপনি যেকোনো পেয়ার এবং টাইমফ্রেমের জন্য সর্বশেষ এবং সবচেয়ে প্রাসঙ্গিক প্যাটার্নগুলো খুঁজে পাবেন।
Triple Top
was formed on 16.04 at 04:45:18 (UTC+0)
signal strength 1 of 5
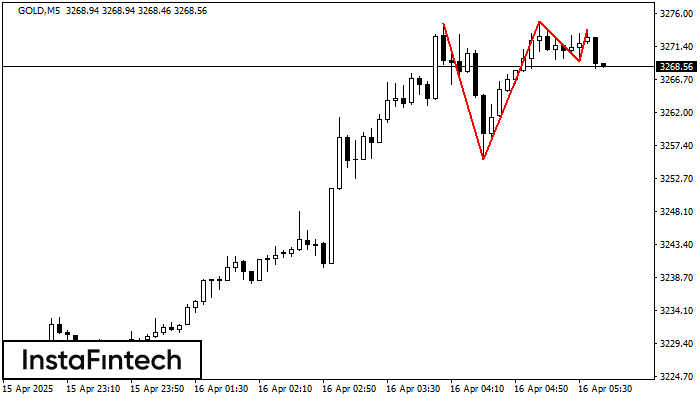
The Triple Top pattern has formed on the chart of the GOLD M5 trading instrument. It is a reversal pattern featuring the following characteristics: resistance level 87, support level -1386, and pattern’s width 1914. Forecast If the price breaks through the support level 3255.48, it is likely to move further down to 3274.78.
The M5 and M15 time frames may have more false entry points.
- All
- All
- Bearish Rectangle
- Bearish Symmetrical Triangle
- Bearish Symmetrical Triangle
- Bullish Rectangle
- Double Top
- Double Top
- Triple Bottom
- Triple Bottom
- Triple Top
- Triple Top
- All
- All
- Buy
- Sale
- All
- 1
- 2
- 3
- 4
- 5
Bearish Rectangle
was formed on 14.05 at 15:00:57 (UTC+0)
signal strength 1 of 5
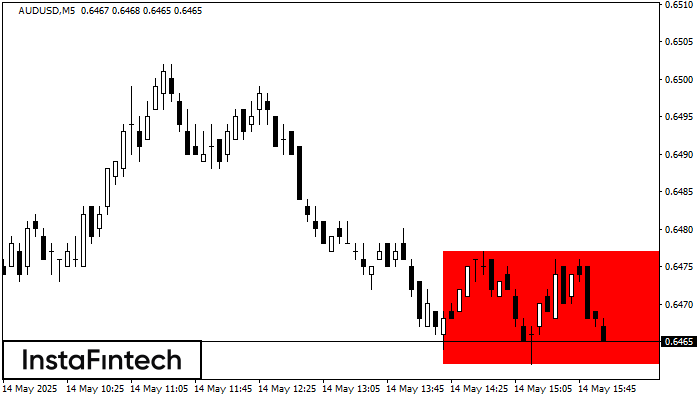
According to the chart of M5, AUDUSD formed the Bearish Rectangle. The pattern indicates a trend continuation. The upper border is 0.6477, the lower border is 0.6462. The signal means
The M5 and M15 time frames may have more false entry points.
Open chart in a new window
Bullish Rectangle
was formed on 14.05 at 14:43:51 (UTC+0)
signal strength 1 of 5
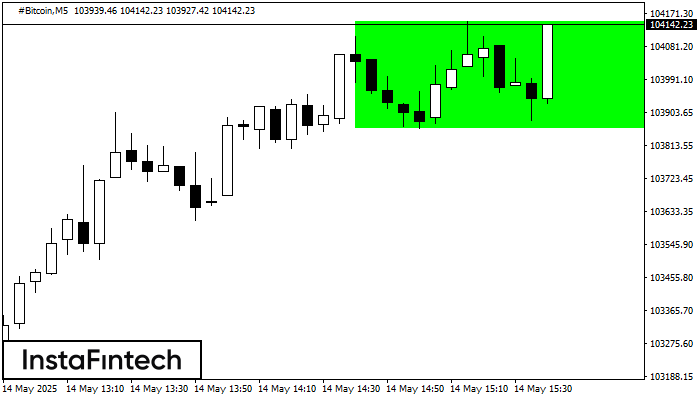
According to the chart of M5, #Bitcoin formed the Bullish Rectangle. This type of a pattern indicates a trend continuation. It consists of two levels: resistance 104149.50 and support 103860.12
The M5 and M15 time frames may have more false entry points.
Open chart in a new window
Double Top
was formed on 14.05 at 14:15:17 (UTC+0)
signal strength 2 of 5
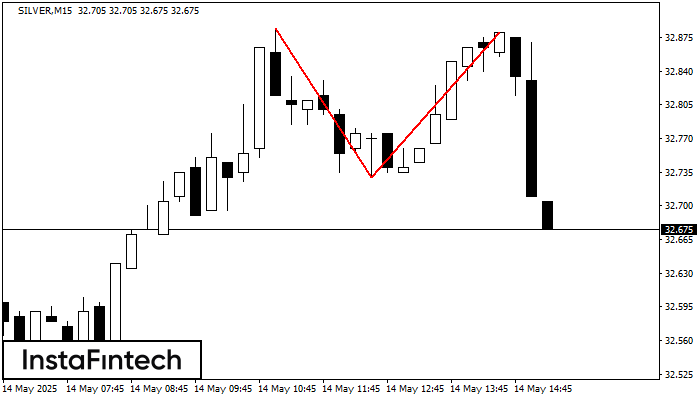
On the chart of SILVER M15 the Double Top reversal pattern has been formed. Characteristics: the upper boundary 32.88; the lower boundary 32.73; the width of the pattern 150 points
The M5 and M15 time frames may have more false entry points.
Open chart in a new window

