

অ্যাকচুয়াল প্যাটার্নস

প্যাটার্ন হলো গ্রাফিক্যাল মডেল, যা মূল্য ওঠানামার ভিত্তিতে চার্টে তৈরি হয়। টেকনিক্যাল বিশ্লেষণের নীতি অনুযায়ী, ইতিহাসের (প্রাইস মুভমেন্ট) পুনরাবৃত্তি ঘটে। অর্থাৎ, পরিস্থিতি যদি একই রকম থাকে তাহলে প্রাইস মুভমেন্টও প্রায় একই রকম হয়। এর ফলে মূল্যের ওঠানামা কেমন হবে তা আগেই থেকেই অনুমান করা যায়।
ইন্সটাফরেক্স এর প্রাসঙ্গিক প্যাটার্নসমূহ সহজেই ব্যবহার করা যায়, যার মাধ্যমে মার্কেটের সর্বশেষ পরিস্থিতি জানা যায় এবং তার উপর ভিত্তি করে সিদ্ধান্ত নেওয়া যায়। আমাদের সেবাগুলো থেকে আপনি যেকোনো পেয়ার এবং টাইমফ্রেমের জন্য সর্বশেষ এবং সবচেয়ে প্রাসঙ্গিক প্যাটার্নগুলো খুঁজে পাবেন।
Bearish Rectangle
was formed on 16.04 at 01:07:48 (UTC+0)
signal strength 1 of 5
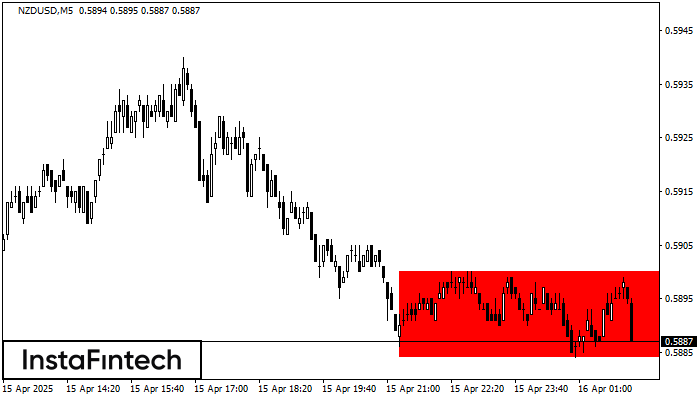
According to the chart of M5, NZDUSD formed the Bearish Rectangle. The pattern indicates a trend continuation. The upper border is 0.5900, the lower border is 0.5884. The signal means that a short position should be opened after fixing a price below the lower border 0.5884 of the Bearish Rectangle.
The M5 and M15 time frames may have more false entry points.
- All
- All
- Bearish Rectangle
- Bearish Symmetrical Triangle
- Bearish Symmetrical Triangle
- Bullish Rectangle
- Double Top
- Double Top
- Triple Bottom
- Triple Bottom
- Triple Top
- Triple Top
- All
- All
- Buy
- Sale
- All
- 1
- 2
- 3
- 4
- 5
Triple Top
was formed on 08.05 at 16:35:16 (UTC+0)
signal strength 1 of 5
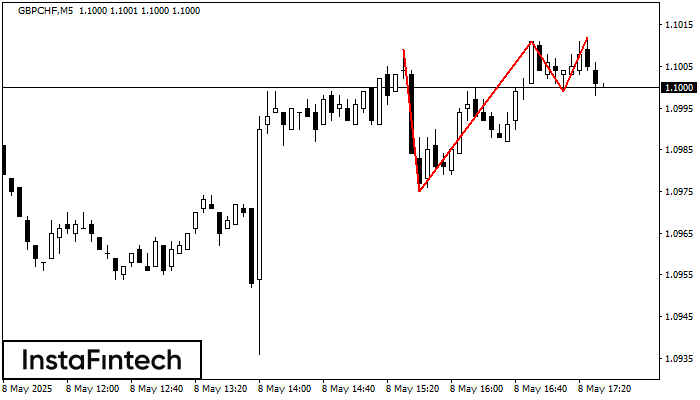
On the chart of the GBPCHF M5 trading instrument, the Triple Top pattern that signals a trend change has formed. It is possible that after formation of the third peak
The M5 and M15 time frames may have more false entry points.
Open chart in a new window
Head and Shoulders
was formed on 08.05 at 16:30:40 (UTC+0)
signal strength 1 of 5
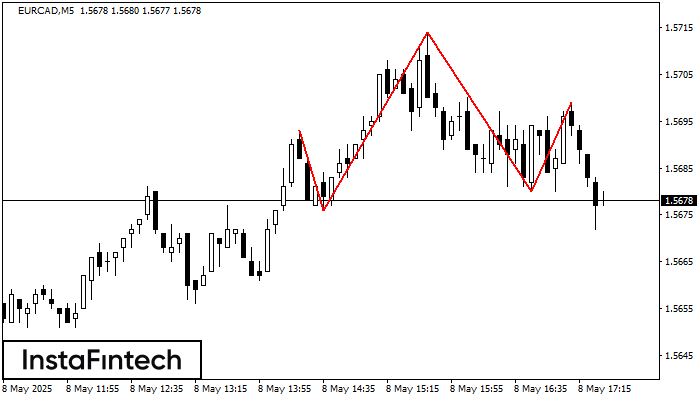
According to the chart of M5, EURCAD formed the Head and Shoulders pattern. The Head’s top is set at 1.5714 while the median line of the Neck is found
The M5 and M15 time frames may have more false entry points.
Open chart in a new window
Bullish pennant
was formed on 08.05 at 16:10:28 (UTC+0)
signal strength 1 of 5
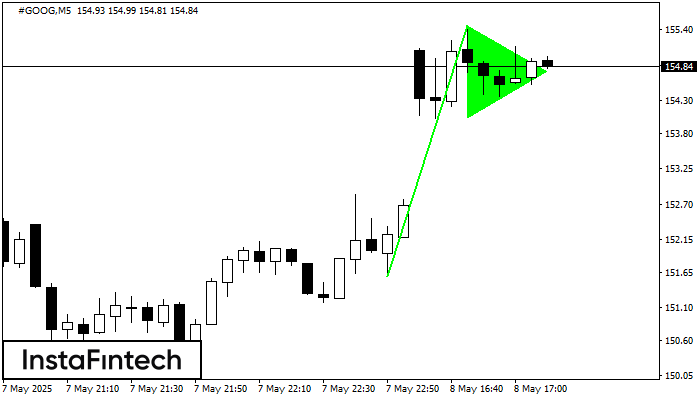
The Bullish pennant graphic pattern has formed on the #GOOG M5 instrument. This pattern type falls under the category of continuation patterns. In this case, if the quote can breaks
The M5 and M15 time frames may have more false entry points.
Open chart in a new window


