

অ্যাকচুয়াল প্যাটার্নস

প্যাটার্ন হলো গ্রাফিক্যাল মডেল, যা মূল্য ওঠানামার ভিত্তিতে চার্টে তৈরি হয়। টেকনিক্যাল বিশ্লেষণের নীতি অনুযায়ী, ইতিহাসের (প্রাইস মুভমেন্ট) পুনরাবৃত্তি ঘটে। অর্থাৎ, পরিস্থিতি যদি একই রকম থাকে তাহলে প্রাইস মুভমেন্টও প্রায় একই রকম হয়। এর ফলে মূল্যের ওঠানামা কেমন হবে তা আগেই থেকেই অনুমান করা যায়।
ইন্সটাফরেক্স এর প্রাসঙ্গিক প্যাটার্নসমূহ সহজেই ব্যবহার করা যায়, যার মাধ্যমে মার্কেটের সর্বশেষ পরিস্থিতি জানা যায় এবং তার উপর ভিত্তি করে সিদ্ধান্ত নেওয়া যায়। আমাদের সেবাগুলো থেকে আপনি যেকোনো পেয়ার এবং টাইমফ্রেমের জন্য সর্বশেষ এবং সবচেয়ে প্রাসঙ্গিক প্যাটার্নগুলো খুঁজে পাবেন।
Triple Bottom
was formed on 14.04 at 08:00:19 (UTC+0)
signal strength 2 of 5
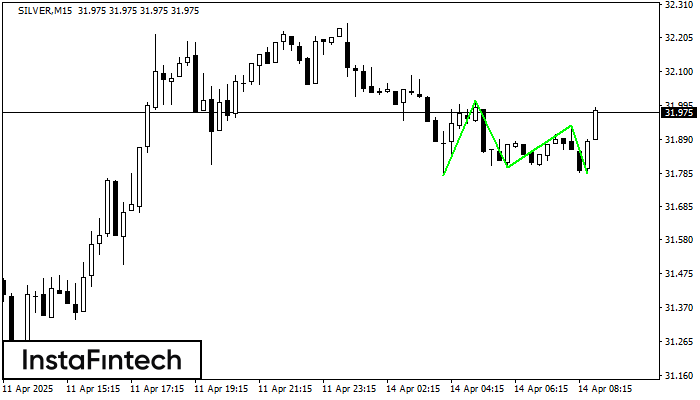
The Triple Bottom pattern has formed on the chart of the SILVER M15 trading instrument. The pattern signals a change in the trend from downwards to upwards in the case of breakdown of 32.01/31.93.
The M5 and M15 time frames may have more false entry points.
আরও দেখুন
- All
- All
- Bearish Rectangle
- Bearish Symmetrical Triangle
- Bearish Symmetrical Triangle
- Bullish Rectangle
- Double Top
- Double Top
- Triple Bottom
- Triple Bottom
- Triple Top
- Triple Top
- All
- All
- Buy
- Sale
- All
- 1
- 2
- 3
- 4
- 5
Double Top
was formed on 07.05 at 03:30:19 (UTC+0)
signal strength 2 of 5
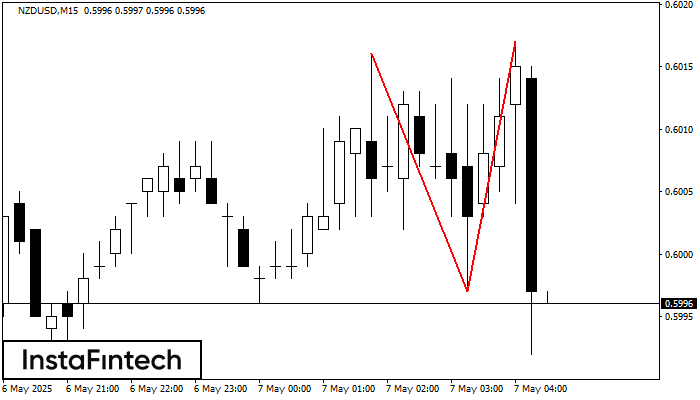
The Double Top reversal pattern has been formed on NZDUSD M15. Characteristics: the upper boundary 0.6016; the lower boundary 0.5997; the width of the pattern is 20 points. Sell trades
The M5 and M15 time frames may have more false entry points.
Open chart in a new window
Double Top
was formed on 07.05 at 03:30:05 (UTC+0)
signal strength 2 of 5
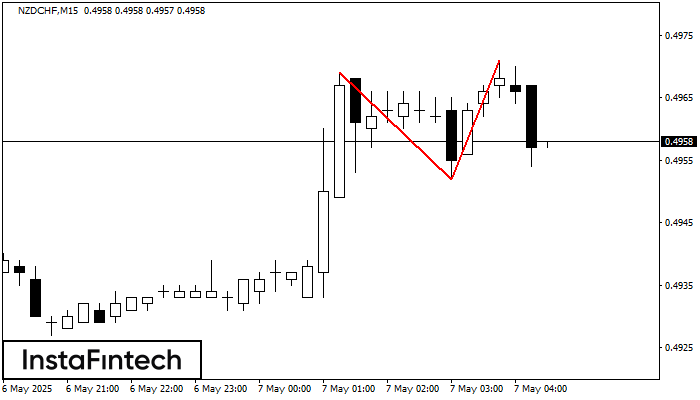
On the chart of NZDCHF M15 the Double Top reversal pattern has been formed. Characteristics: the upper boundary 0.4971; the lower boundary 0.4952; the width of the pattern 19 points
The M5 and M15 time frames may have more false entry points.
Open chart in a new window
Bullish Symmetrical Triangle
was formed on 07.05 at 03:14:47 (UTC+0)
signal strength 1 of 5
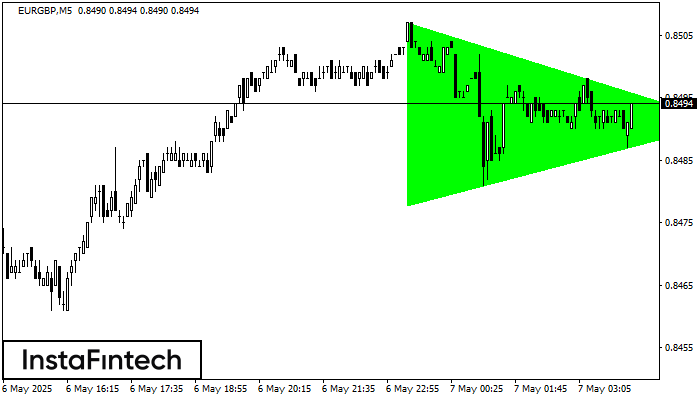
According to the chart of M5, EURGBP formed the Bullish Symmetrical Triangle pattern. Description: This is the pattern of a trend continuation. 0.8507 and 0.8478 are the coordinates
The M5 and M15 time frames may have more false entry points.
Open chart in a new window


