

অ্যাকচুয়াল প্যাটার্নস

প্যাটার্ন হলো গ্রাফিক্যাল মডেল, যা মূল্য ওঠানামার ভিত্তিতে চার্টে তৈরি হয়। টেকনিক্যাল বিশ্লেষণের নীতি অনুযায়ী, ইতিহাসের (প্রাইস মুভমেন্ট) পুনরাবৃত্তি ঘটে। অর্থাৎ, পরিস্থিতি যদি একই রকম থাকে তাহলে প্রাইস মুভমেন্টও প্রায় একই রকম হয়। এর ফলে মূল্যের ওঠানামা কেমন হবে তা আগেই থেকেই অনুমান করা যায়।
ইন্সটাফরেক্স এর প্রাসঙ্গিক প্যাটার্নসমূহ সহজেই ব্যবহার করা যায়, যার মাধ্যমে মার্কেটের সর্বশেষ পরিস্থিতি জানা যায় এবং তার উপর ভিত্তি করে সিদ্ধান্ত নেওয়া যায়। আমাদের সেবাগুলো থেকে আপনি যেকোনো পেয়ার এবং টাইমফ্রেমের জন্য সর্বশেষ এবং সবচেয়ে প্রাসঙ্গিক প্যাটার্নগুলো খুঁজে পাবেন।
Double Top
was formed on 08.04 at 07:55:14 (UTC+0)
signal strength 1 of 5
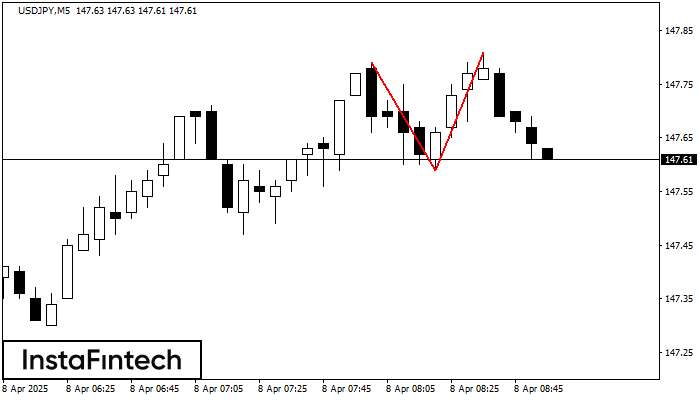
On the chart of USDJPY M5 the Double Top reversal pattern has been formed. Characteristics: the upper boundary 147.81; the lower boundary 147.59; the width of the pattern 22 points. The signal: a break of the lower boundary will cause continuation of the downward trend targeting the 147.44 level.
The M5 and M15 time frames may have more false entry points.
আরও দেখুন
- All
- All
- Bearish Rectangle
- Bearish Symmetrical Triangle
- Bearish Symmetrical Triangle
- Bullish Rectangle
- Double Top
- Double Top
- Triple Bottom
- Triple Bottom
- Triple Top
- Triple Top
- All
- All
- Buy
- Sale
- All
- 1
- 2
- 3
- 4
- 5
Double Bottom
was formed on 06.05 at 03:45:33 (UTC+0)
signal strength 1 of 5
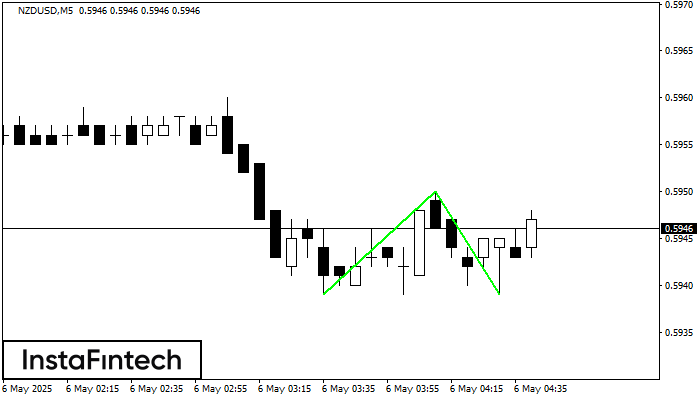
Corak Double Bottom telah dibentuk pada NZDUSD M5; sempadan atas adalah 0.5950; sempadan bawah adalah 0.5939. Lebar corak adalah 11 mata. Sekiranya penembusan sempadan atas 0.5950, perubahan aliran boleh diramalkan
Carta masa M5 dan M15 mungkin mempunyai lebih banyak titik kemasukan palsu.
Open chart in a new window
Triple Bottom
was formed on 06.05 at 03:00:35 (UTC+0)
signal strength 4 of 5

Corak Triple Bottom telah dibentuk pada GBPCHF H1. Ia mempunyai ciri-ciri berikut: tahap rintangan 1.0997/1.0988; tahap sokongan 1.0919/1.0919; lebar corak adalah 78 mata. Dalam situasi penembusan paras rintangan 1.0997, harga
Open chart in a new window
Triple Bottom
was formed on 06.05 at 03:00:33 (UTC+0)
signal strength 4 of 5
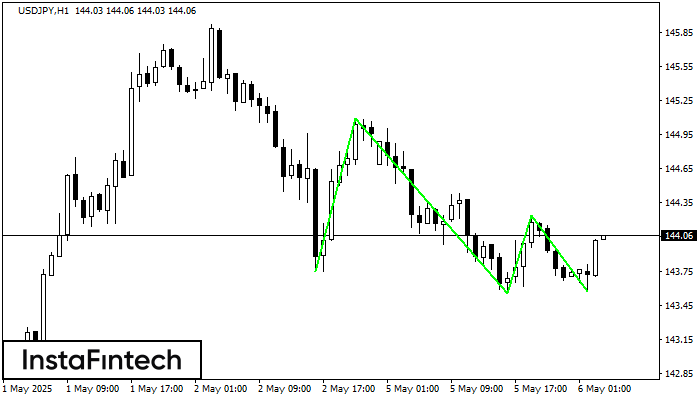
Corak Triple Bottom telah dibentuk pada carta USDJPY H1. Ciri-ciri corak: Garisan bawah corak mempunyai koordinat 145.09 dengan had atas 145.09/144.24, unjuran lebar adalah 134 mata. Pembentukan corak Triple Bottom
Open chart in a new window


