

অ্যাকচুয়াল প্যাটার্নস

প্যাটার্ন হলো গ্রাফিক্যাল মডেল, যা মূল্য ওঠানামার ভিত্তিতে চার্টে তৈরি হয়। টেকনিক্যাল বিশ্লেষণের নীতি অনুযায়ী, ইতিহাসের (প্রাইস মুভমেন্ট) পুনরাবৃত্তি ঘটে। অর্থাৎ, পরিস্থিতি যদি একই রকম থাকে তাহলে প্রাইস মুভমেন্টও প্রায় একই রকম হয়। এর ফলে মূল্যের ওঠানামা কেমন হবে তা আগেই থেকেই অনুমান করা যায়।
ইন্সটাফরেক্স এর প্রাসঙ্গিক প্যাটার্নসমূহ সহজেই ব্যবহার করা যায়, যার মাধ্যমে মার্কেটের সর্বশেষ পরিস্থিতি জানা যায় এবং তার উপর ভিত্তি করে সিদ্ধান্ত নেওয়া যায়। আমাদের সেবাগুলো থেকে আপনি যেকোনো পেয়ার এবং টাইমফ্রেমের জন্য সর্বশেষ এবং সবচেয়ে প্রাসঙ্গিক প্যাটার্নগুলো খুঁজে পাবেন।
Triple Top
was formed on 08.04 at 02:00:05 (UTC+0)
signal strength 2 of 5
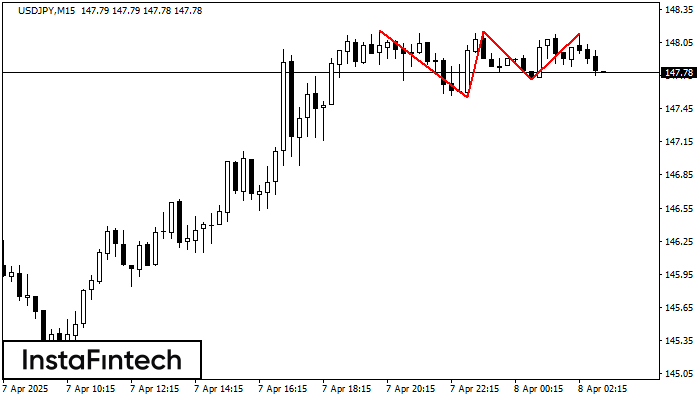
The Triple Top pattern has formed on the chart of the USDJPY M15 trading instrument. It is a reversal pattern featuring the following characteristics: resistance level 3, support level -17, and pattern’s width 61. Forecast If the price breaks through the support level 147.55, it is likely to move further down to 147.93.
The M5 and M15 time frames may have more false entry points.
- All
- All
- Bearish Rectangle
- Bearish Symmetrical Triangle
- Bearish Symmetrical Triangle
- Bullish Rectangle
- Double Top
- Double Top
- Triple Bottom
- Triple Bottom
- Triple Top
- Triple Top
- All
- All
- Buy
- Sale
- All
- 1
- 2
- 3
- 4
- 5
Triple Top
сформирован 21.04 в 12:40:05 (UTC+0)
сила сигнала 1 из 5

On the chart of the GOLD M5 trading instrument, the Triple Top pattern that signals a trend change has formed. It is possible that after formation of the third peak
The M5 and M15 time frames may have more false entry points.
Открыть график инструмента в новом окне
Bearish Symmetrical Triangle
сформирован 21.04 в 12:20:58 (UTC+0)
сила сигнала 1 из 5

According to the chart of M5, GBPCHF formed the Bearish Symmetrical Triangle pattern. Trading recommendations: A breach of the lower border 1.0783 is likely to encourage a continuation
The M5 and M15 time frames may have more false entry points.
Открыть график инструмента в новом окне
Triple Bottom
сформирован 21.04 в 12:15:45 (UTC+0)
сила сигнала 2 из 5

The Triple Bottom pattern has formed on the chart of USDJPY M15. Features of the pattern: The lower line of the pattern has coordinates 140.99 with the upper limit 140.99/140.92
The M5 and M15 time frames may have more false entry points.
Открыть график инструмента в новом окне


