

অ্যাকচুয়াল প্যাটার্নস

প্যাটার্ন হলো গ্রাফিক্যাল মডেল, যা মূল্য ওঠানামার ভিত্তিতে চার্টে তৈরি হয়। টেকনিক্যাল বিশ্লেষণের নীতি অনুযায়ী, ইতিহাসের (প্রাইস মুভমেন্ট) পুনরাবৃত্তি ঘটে। অর্থাৎ, পরিস্থিতি যদি একই রকম থাকে তাহলে প্রাইস মুভমেন্টও প্রায় একই রকম হয়। এর ফলে মূল্যের ওঠানামা কেমন হবে তা আগেই থেকেই অনুমান করা যায়।
ইন্সটাফরেক্স এর প্রাসঙ্গিক প্যাটার্নসমূহ সহজেই ব্যবহার করা যায়, যার মাধ্যমে মার্কেটের সর্বশেষ পরিস্থিতি জানা যায় এবং তার উপর ভিত্তি করে সিদ্ধান্ত নেওয়া যায়। আমাদের সেবাগুলো থেকে আপনি যেকোনো পেয়ার এবং টাইমফ্রেমের জন্য সর্বশেষ এবং সবচেয়ে প্রাসঙ্গিক প্যাটার্নগুলো খুঁজে পাবেন।
Bearish pennant
was formed on 07.04 at 00:45:25 (UTC+0)
signal strength 2 of 5
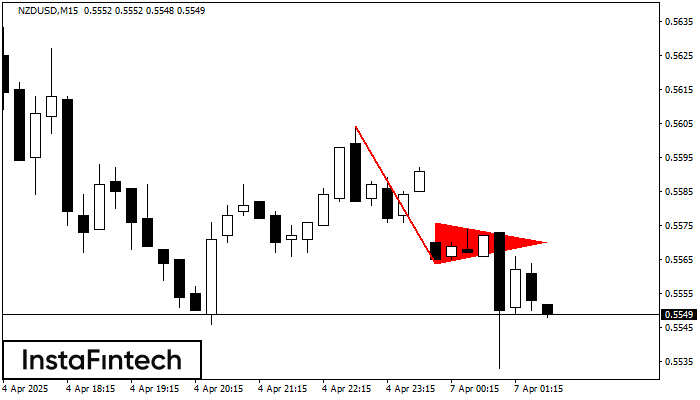
The Bearish pennant pattern has formed on the NZDUSD M15 chart. It signals potential continuation of the existing trend. Specifications: the pattern’s bottom has the coordinate of 0.5564; the projection of the flagpole height is equal to 40 pips. In case the price breaks out the pattern’s bottom of 0.5564, the downtrend is expected to continue for further level 0.5541.
The M5 and M15 time frames may have more false entry points.
আরও দেখুন
- All
- All
- Bearish Rectangle
- Bearish Symmetrical Triangle
- Bearish Symmetrical Triangle
- Bullish Rectangle
- Double Top
- Double Top
- Triple Bottom
- Triple Bottom
- Triple Top
- Triple Top
- All
- All
- Buy
- Sale
- All
- 1
- 2
- 3
- 4
- 5
Bearish Symmetrical Triangle
was formed on 04.05 at 09:04:31 (UTC+0)
signal strength 2 of 5

According to the chart of M15, #Bitcoin formed the Bearish Symmetrical Triangle pattern. Trading recommendations: A breach of the lower border 95528.76 is likely to encourage a continuation
The M5 and M15 time frames may have more false entry points.
Open chart in a new window
Bearish Rectangle
was formed on 04.05 at 00:51:55 (UTC+0)
signal strength 3 of 5

According to the chart of M30, #Bitcoin formed the Bearish Rectangle. This type of a pattern indicates a trend continuation. It consists of two levels: resistance 96456.78 - 0.00
Open chart in a new window
Double Bottom
was formed on 03.05 at 10:45:44 (UTC+0)
signal strength 2 of 5

The Double Bottom pattern has been formed on #Bitcoin M15. This formation signals a reversal of the trend from downwards to upwards. The signal is that a buy trade should
The M5 and M15 time frames may have more false entry points.
Open chart in a new window


