

অ্যাকচুয়াল প্যাটার্নস

প্যাটার্ন হলো গ্রাফিক্যাল মডেল, যা মূল্য ওঠানামার ভিত্তিতে চার্টে তৈরি হয়। টেকনিক্যাল বিশ্লেষণের নীতি অনুযায়ী, ইতিহাসের (প্রাইস মুভমেন্ট) পুনরাবৃত্তি ঘটে। অর্থাৎ, পরিস্থিতি যদি একই রকম থাকে তাহলে প্রাইস মুভমেন্টও প্রায় একই রকম হয়। এর ফলে মূল্যের ওঠানামা কেমন হবে তা আগেই থেকেই অনুমান করা যায়।
ইন্সটাফরেক্স এর প্রাসঙ্গিক প্যাটার্নসমূহ সহজেই ব্যবহার করা যায়, যার মাধ্যমে মার্কেটের সর্বশেষ পরিস্থিতি জানা যায় এবং তার উপর ভিত্তি করে সিদ্ধান্ত নেওয়া যায়। আমাদের সেবাগুলো থেকে আপনি যেকোনো পেয়ার এবং টাইমফ্রেমের জন্য সর্বশেষ এবং সবচেয়ে প্রাসঙ্গিক প্যাটার্নগুলো খুঁজে পাবেন।
Triple Bottom
was formed on 04.04 at 11:25:26 (UTC+0)
signal strength 1 of 5
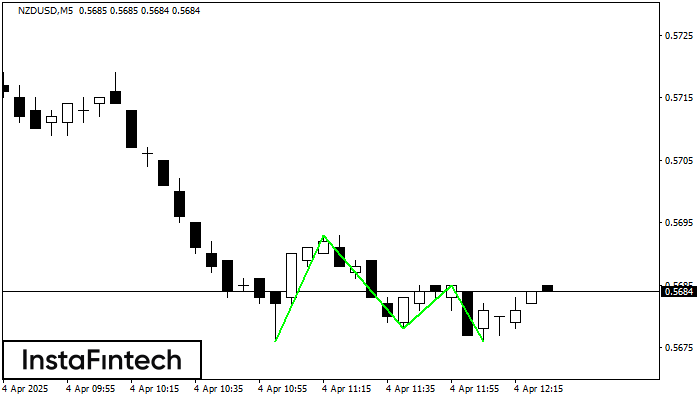
The Triple Bottom pattern has been formed on NZDUSD M5. It has the following characteristics: resistance level 0.5693/0.5685; support level 0.5676/0.5676; the width is 17 points. In the event of a breakdown of the resistance level of 0.5693, the price is likely to continue an upward movement at least to 0.5693.
The M5 and M15 time frames may have more false entry points.
আরও দেখুন
- All
- All
- Bearish Rectangle
- Bearish Symmetrical Triangle
- Bearish Symmetrical Triangle
- Bullish Rectangle
- Double Top
- Double Top
- Triple Bottom
- Triple Bottom
- Triple Top
- Triple Top
- All
- All
- Buy
- Sale
- All
- 1
- 2
- 3
- 4
- 5
বুলিশ পেন্যান্ট
was formed on 13.04 at 11:56:52 (UTC+0)
signal strength 1 of 5

বুলিশ পেন্যান্ট সংকেত – M5 -এ #Bitcoin ট্রেডিং ইন্সট্রুমেন্টের ধারাবাহিকতার প্যাটার্ন। পূর্বাভাস: প্যাটার্নের সর্বোচ্চ 84963.00 এর উপরে বাই পজিশন নির্ধারণ করা সম্ভব, পরবর্তী পদক্ষেপে ফ্ল্যাগপোলের উচ্চতার একটি প্রজেকশনের সম্ভাবনা রয়েছে।
M5 এবং M15 টাইম ফ্রেমে আরও ভুল এন্ট্রি পয়েন্ট থাকতে পারে।
Open chart in a new window
বুলিশ রেক্ট্যাঙ্গেল
was formed on 11.04 at 22:20:31 (UTC+0)
signal strength 1 of 5

M5 চার্ট অনুযায়ী, NZDCHF বুলিশ রেক্ট্যাঙ্গেল গঠন করেছে। এই প্যাটার্ন চলমান প্রবণতার ধারাবাহিকতা নির্দেশ করে। উপরের সীমানা হল 0.4754, নীচের সীমানা হল 0.4746৷ এই সংকেতের অর্থ হল বুলিশ রেক্ট্যাঙ্গেল -এর
M5 এবং M15 টাইম ফ্রেমে আরও ভুল এন্ট্রি পয়েন্ট থাকতে পারে।
Open chart in a new window
বিয়ারিশ রেক্ট্যাঙ্গেল
was formed on 11.04 at 22:10:27 (UTC+0)
signal strength 1 of 5

M5 চার্ট অনুসারে, USDCAD বিয়ারিশ রেক্ট্যাঙ্গেল গঠন করেছে যা চলমান প্রবণতার ধারাবাহিকতার প্যাটার্ন। প্যাটার্নটি নিম্নলিখিত সীমানার মধ্যে রয়েছে: নীচের সীমানা 1.3871 – 1.3871 এবং উপরের সীমানা 1.3891 – 1.3891৷ নীচের
M5 এবং M15 টাইম ফ্রেমে আরও ভুল এন্ট্রি পয়েন্ট থাকতে পারে।
Open chart in a new window


