

অ্যাকচুয়াল প্যাটার্নস

প্যাটার্ন হলো গ্রাফিক্যাল মডেল, যা মূল্য ওঠানামার ভিত্তিতে চার্টে তৈরি হয়। টেকনিক্যাল বিশ্লেষণের নীতি অনুযায়ী, ইতিহাসের (প্রাইস মুভমেন্ট) পুনরাবৃত্তি ঘটে। অর্থাৎ, পরিস্থিতি যদি একই রকম থাকে তাহলে প্রাইস মুভমেন্টও প্রায় একই রকম হয়। এর ফলে মূল্যের ওঠানামা কেমন হবে তা আগেই থেকেই অনুমান করা যায়।
ইন্সটাফরেক্স এর প্রাসঙ্গিক প্যাটার্নসমূহ সহজেই ব্যবহার করা যায়, যার মাধ্যমে মার্কেটের সর্বশেষ পরিস্থিতি জানা যায় এবং তার উপর ভিত্তি করে সিদ্ধান্ত নেওয়া যায়। আমাদের সেবাগুলো থেকে আপনি যেকোনো পেয়ার এবং টাইমফ্রেমের জন্য সর্বশেষ এবং সবচেয়ে প্রাসঙ্গিক প্যাটার্নগুলো খুঁজে পাবেন।
Double Top
was formed on 02.04 at 12:15:40 (UTC+0)
signal strength 2 of 5
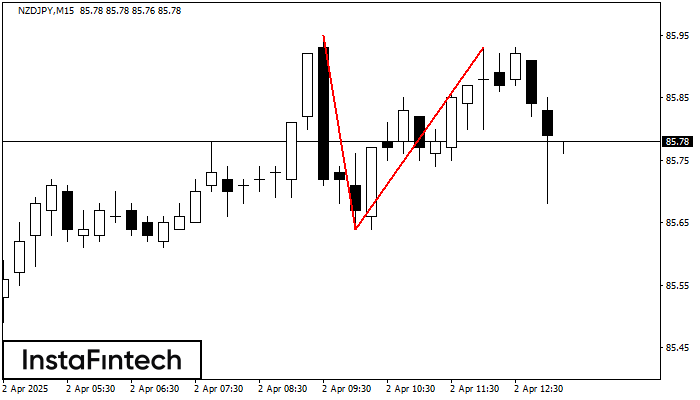
The Double Top reversal pattern has been formed on NZDJPY M15. Characteristics: the upper boundary 85.95; the lower boundary 85.64; the width of the pattern is 29 points. Sell trades are better to be opened below the lower boundary 85.64 with a possible movements towards the 85.42 level.
The M5 and M15 time frames may have more false entry points.
- All
- All
- Bearish Rectangle
- Bearish Symmetrical Triangle
- Bearish Symmetrical Triangle
- Bullish Rectangle
- Double Top
- Double Top
- Triple Bottom
- Triple Bottom
- Triple Top
- Triple Top
- All
- All
- Buy
- Sale
- All
- 1
- 2
- 3
- 4
- 5
Double Bottom
was formed on 04.06 at 23:40:22 (UTC+0)
signal strength 1 of 5
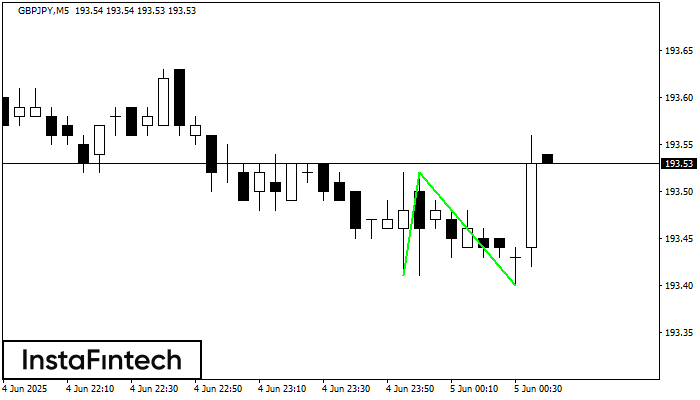
The Double Bottom pattern has been formed on GBPJPY M5. This formation signals a reversal of the trend from downwards to upwards. The signal is that a buy trade should
The M5 and M15 time frames may have more false entry points.
Open chart in a new window
Double Bottom
was formed on 04.06 at 23:15:29 (UTC+0)
signal strength 2 of 5
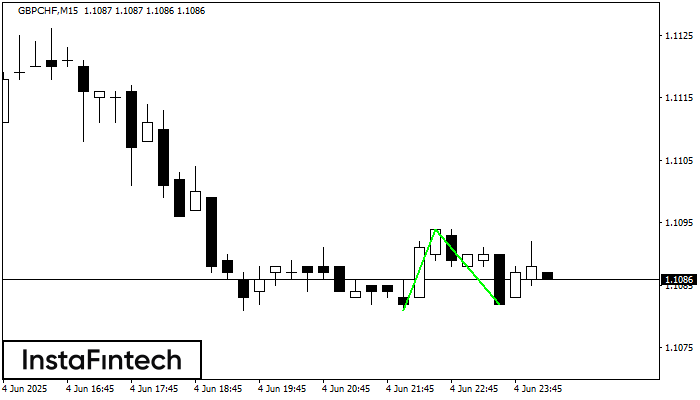
The Double Bottom pattern has been formed on GBPCHF M15. Characteristics: the support level 1.1081; the resistance level 1.1094; the width of the pattern 13 points. If the resistance level
The M5 and M15 time frames may have more false entry points.
Open chart in a new window
Head and Shoulders
was formed on 04.06 at 21:56:17 (UTC+0)
signal strength 1 of 5
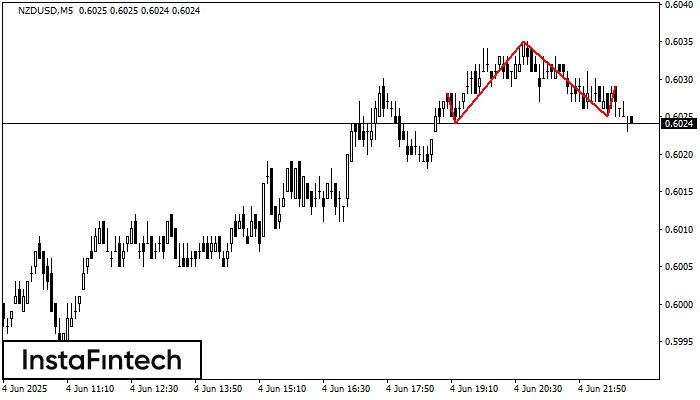
According to the chart of M5, NZDUSD formed the Head and Shoulders pattern. The Head’s top is set at 0.6035 while the median line of the Neck is found
The M5 and M15 time frames may have more false entry points.
Open chart in a new window


