

অ্যাকচুয়াল প্যাটার্নস

প্যাটার্ন হলো গ্রাফিক্যাল মডেল, যা মূল্য ওঠানামার ভিত্তিতে চার্টে তৈরি হয়। টেকনিক্যাল বিশ্লেষণের নীতি অনুযায়ী, ইতিহাসের (প্রাইস মুভমেন্ট) পুনরাবৃত্তি ঘটে। অর্থাৎ, পরিস্থিতি যদি একই রকম থাকে তাহলে প্রাইস মুভমেন্টও প্রায় একই রকম হয়। এর ফলে মূল্যের ওঠানামা কেমন হবে তা আগেই থেকেই অনুমান করা যায়।
ইন্সটাফরেক্স এর প্রাসঙ্গিক প্যাটার্নসমূহ সহজেই ব্যবহার করা যায়, যার মাধ্যমে মার্কেটের সর্বশেষ পরিস্থিতি জানা যায় এবং তার উপর ভিত্তি করে সিদ্ধান্ত নেওয়া যায়। আমাদের সেবাগুলো থেকে আপনি যেকোনো পেয়ার এবং টাইমফ্রেমের জন্য সর্বশেষ এবং সবচেয়ে প্রাসঙ্গিক প্যাটার্নগুলো খুঁজে পাবেন।
Triple Top
was formed on 01.04 at 19:30:14 (UTC+0)
signal strength 1 of 5
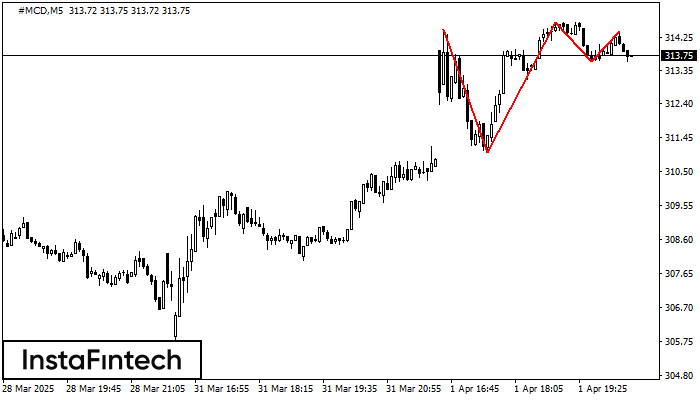
On the chart of the #MCD M5 trading instrument, the Triple Top pattern that signals a trend change has formed. It is possible that after formation of the third peak, the price will try to break through the resistance level 311.03, where we advise to open a trading position for sale. Take profit is the projection of the pattern’s width, which is 345 points.
The M5 and M15 time frames may have more false entry points.
আরও দেখুন
- All
- All
- Bearish Rectangle
- Bearish Symmetrical Triangle
- Bearish Symmetrical Triangle
- Bullish Rectangle
- Double Top
- Double Top
- Triple Bottom
- Triple Bottom
- Triple Top
- Triple Top
- All
- All
- Buy
- Sale
- All
- 1
- 2
- 3
- 4
- 5
ট্রিপল বটম
was formed on 21.04 at 22:01:24 (UTC+0)
signal strength 3 of 5

M30 চার্টে, USDJPY ট্রেডিং ইন্সট্রুমেন্টের ট্রিপল বটম প্যাটার্ন গঠিত হয়েছে। 141.08/141.05 ব্রেকডাউনের ক্ষেত্রে এই প্যাটার্ন নিম্নমুখী প্রবণতা থেকে ঊর্ধ্বমুখী প্রবণতায় পরিবর্তনের সংকেত দেয়৷
Open chart in a new window
ডাবল বটম
was formed on 21.04 at 22:00:49 (UTC+0)
signal strength 4 of 5

H1 চার্টে, AUDCHF-এর ডাবল বটম প্যাটার্নটি গঠিত হয়েছে। উপরের সীমানা হল 0.5198; নীচের সীমানা হল 0.5165। প্যাটার্নের প্রস্থ হল 34 পয়েন্ট। 0.5198-এর উপরের সীমানা ভেদ করার ক্ষেত্রে, প্রবণতা পরিবর্তনের পূর্বাভাস
Open chart in a new window
বিয়ারিশ সিমেট্রিক্যাল ট্রায়াঙ্গেল
was formed on 21.04 at 21:58:31 (UTC+0)
signal strength 1 of 5
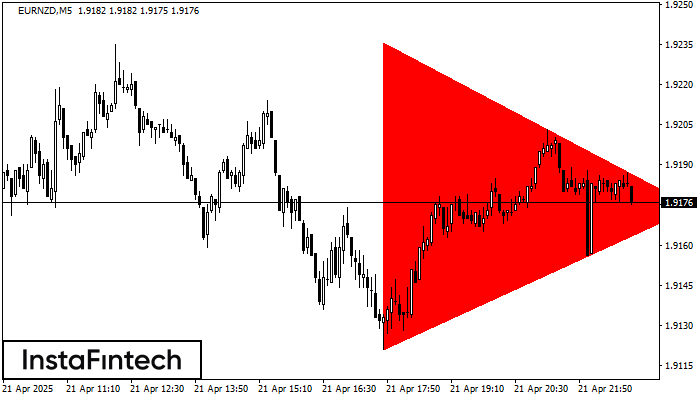
M5 চার্ট অনুযায়ী, EURNZD বিয়ারিশ সিমেট্রিক্যাল ট্রায়াঙ্গেল প্যাটার্ন গঠন করেছে। বর্ণনা: নীচের সীমানা হচ্ছে 1.9121/1.9174 এবং উপরের সীমানা হল 1.9236/1.9174৷ চার্টে প্যাটার্নের প্রস্থ -115 পিপস বলে পরিমাপ করা হয়েছে। বিয়ারিশ
M5 এবং M15 টাইম ফ্রেমে আরও ভুল এন্ট্রি পয়েন্ট থাকতে পারে।
Open chart in a new window


