

অ্যাকচুয়াল প্যাটার্নস

প্যাটার্ন হলো গ্রাফিক্যাল মডেল, যা মূল্য ওঠানামার ভিত্তিতে চার্টে তৈরি হয়। টেকনিক্যাল বিশ্লেষণের নীতি অনুযায়ী, ইতিহাসের (প্রাইস মুভমেন্ট) পুনরাবৃত্তি ঘটে। অর্থাৎ, পরিস্থিতি যদি একই রকম থাকে তাহলে প্রাইস মুভমেন্টও প্রায় একই রকম হয়। এর ফলে মূল্যের ওঠানামা কেমন হবে তা আগেই থেকেই অনুমান করা যায়।
ইন্সটাফরেক্স এর প্রাসঙ্গিক প্যাটার্নসমূহ সহজেই ব্যবহার করা যায়, যার মাধ্যমে মার্কেটের সর্বশেষ পরিস্থিতি জানা যায় এবং তার উপর ভিত্তি করে সিদ্ধান্ত নেওয়া যায়। আমাদের সেবাগুলো থেকে আপনি যেকোনো পেয়ার এবং টাইমফ্রেমের জন্য সর্বশেষ এবং সবচেয়ে প্রাসঙ্গিক প্যাটার্নগুলো খুঁজে পাবেন।
Bullish pennant
was formed on 01.04 at 19:21:14 (UTC+0)
signal strength 1 of 5
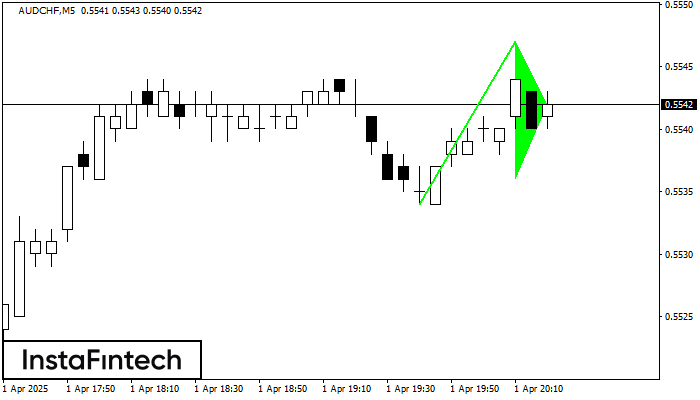
The Bullish pennant pattern is formed on the AUDCHF M5 chart. It is a type of the continuation pattern. Supposedly, in case the price is fixed above the pennant’s high of 0.5547, a further uptrend is possible.
The M5 and M15 time frames may have more false entry points.
- All
- All
- Bearish Rectangle
- Bearish Symmetrical Triangle
- Bearish Symmetrical Triangle
- Bullish Rectangle
- Double Top
- Double Top
- Triple Bottom
- Triple Bottom
- Triple Top
- Triple Top
- All
- All
- Buy
- Sale
- All
- 1
- 2
- 3
- 4
- 5
Bullish Rectangle
сформирован 08.05 в 17:13:01 (UTC+0)
сила сигнала 4 из 5
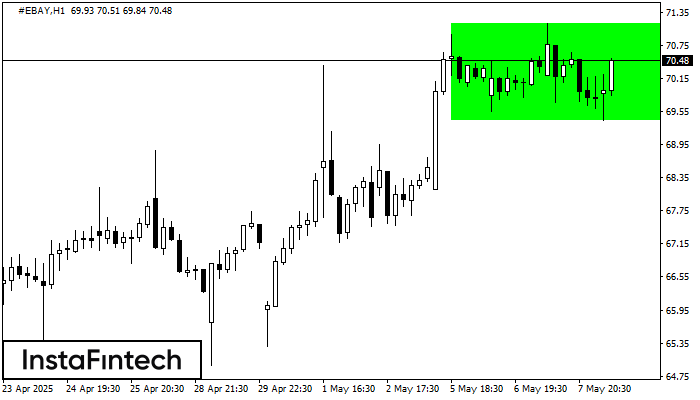
According to the chart of H1, #EBAY formed the Bullish Rectangle which is a pattern of a trend continuation. The pattern is contained within the following borders: the lower border
Открыть график инструмента в новом окне
Bullish Rectangle
сформирован 08.05 в 17:10:50 (UTC+0)
сила сигнала 3 из 5
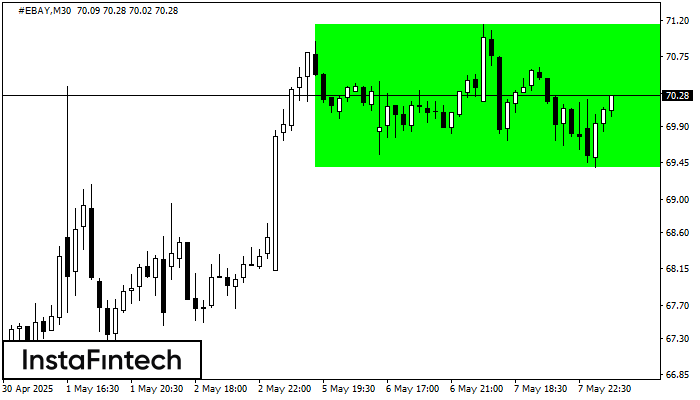
According to the chart of M30, #EBAY formed the Bullish Rectangle. The pattern indicates a trend continuation. The upper border is 71.15, the lower border is 69.39. The signal means
Открыть график инструмента в новом окне
Bearish Symmetrical Triangle
сформирован 08.05 в 16:59:37 (UTC+0)
сила сигнала 3 из 5
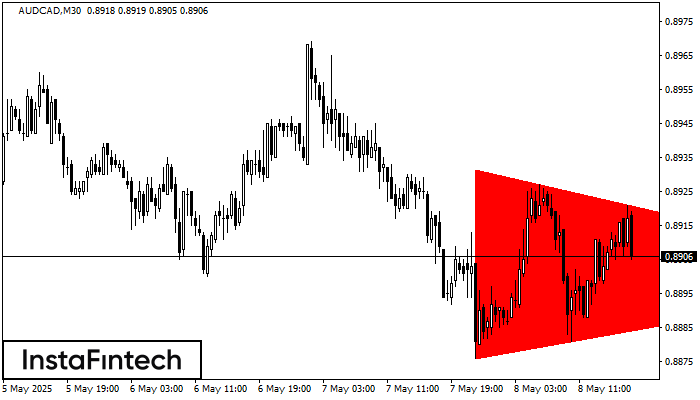
According to the chart of M30, AUDCAD formed the Bearish Symmetrical Triangle pattern. This pattern signals a further downward trend in case the lower border 0.8876 is breached. Here
Открыть график инструмента в новом окне


