

অ্যাকচুয়াল প্যাটার্নস

প্যাটার্ন হলো গ্রাফিক্যাল মডেল, যা মূল্য ওঠানামার ভিত্তিতে চার্টে তৈরি হয়। টেকনিক্যাল বিশ্লেষণের নীতি অনুযায়ী, ইতিহাসের (প্রাইস মুভমেন্ট) পুনরাবৃত্তি ঘটে। অর্থাৎ, পরিস্থিতি যদি একই রকম থাকে তাহলে প্রাইস মুভমেন্টও প্রায় একই রকম হয়। এর ফলে মূল্যের ওঠানামা কেমন হবে তা আগেই থেকেই অনুমান করা যায়।
ইন্সটাফরেক্স এর প্রাসঙ্গিক প্যাটার্নসমূহ সহজেই ব্যবহার করা যায়, যার মাধ্যমে মার্কেটের সর্বশেষ পরিস্থিতি জানা যায় এবং তার উপর ভিত্তি করে সিদ্ধান্ত নেওয়া যায়। আমাদের সেবাগুলো থেকে আপনি যেকোনো পেয়ার এবং টাইমফ্রেমের জন্য সর্বশেষ এবং সবচেয়ে প্রাসঙ্গিক প্যাটার্নগুলো খুঁজে পাবেন।
Triple Bottom
was formed on 31.03 at 13:00:03 (UTC+0)
signal strength 3 of 5
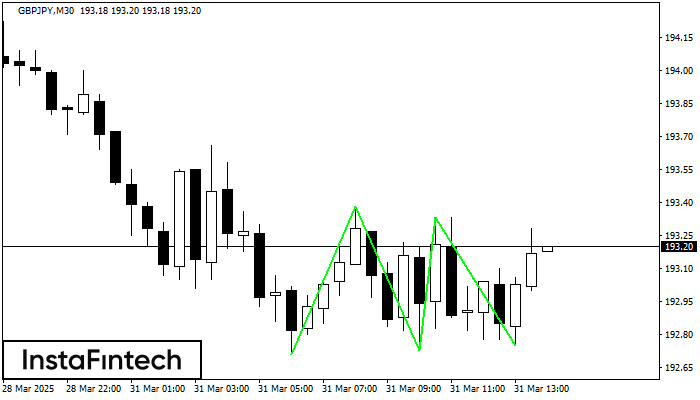
The Triple Bottom pattern has been formed on GBPJPY M30. It has the following characteristics: resistance level 193.38/193.33; support level 192.71/192.75; the width is 67 points. In the event of a breakdown of the resistance level of 193.38, the price is likely to continue an upward movement at least to 193.03.
- All
- All
- Bearish Rectangle
- Bearish Symmetrical Triangle
- Bearish Symmetrical Triangle
- Bullish Rectangle
- Double Top
- Double Top
- Triple Bottom
- Triple Bottom
- Triple Top
- Triple Top
- All
- All
- Buy
- Sale
- All
- 1
- 2
- 3
- 4
- 5
Double Bottom
сформирован 22.04 в 23:05:56 (UTC+0)
сила сигнала 1 из 5
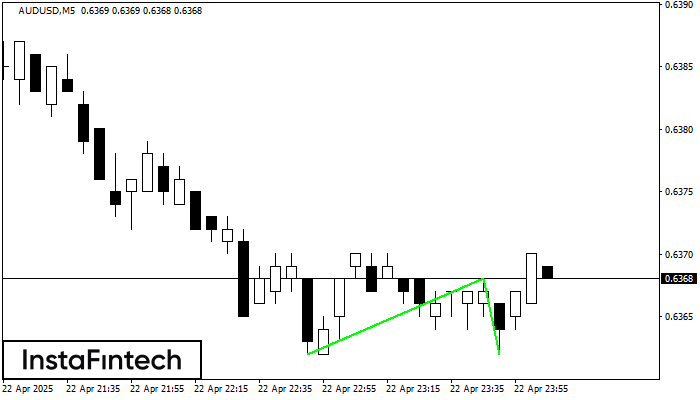
The Double Bottom pattern has been formed on AUDUSD M5; the upper boundary is 0.6368; the lower boundary is 0.6362. The width of the pattern is 6 points. In case
The M5 and M15 time frames may have more false entry points.
Открыть график инструмента в новом окне
Bullish pennant
сформирован 22.04 в 23:00:37 (UTC+0)
сила сигнала 2 из 5
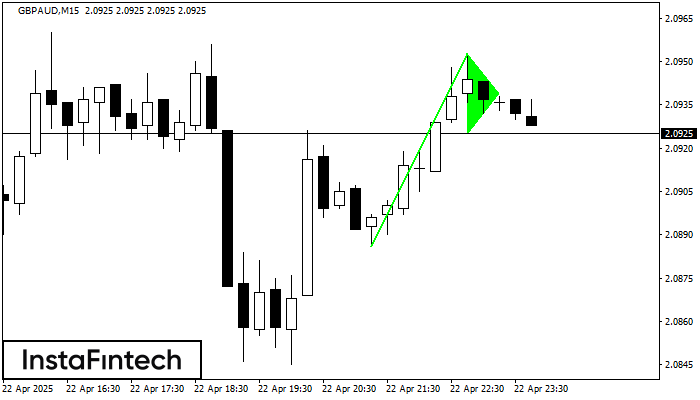
The Bullish pennant signal – Trading instrument GBPAUD M15, continuation pattern. Forecast: it is possible to set up a buy position above the pattern’s high of 2.0953, with the prospect
The M5 and M15 time frames may have more false entry points.
Открыть график инструмента в новом окне
Bullish Rectangle
сформирован 22.04 в 22:14:12 (UTC+0)
сила сигнала 1 из 5

According to the chart of M5, GBPCHF formed the Bullish Rectangle which is a pattern of a trend continuation. The pattern is contained within the following borders: the lower border
The M5 and M15 time frames may have more false entry points.
Открыть график инструмента в новом окне


