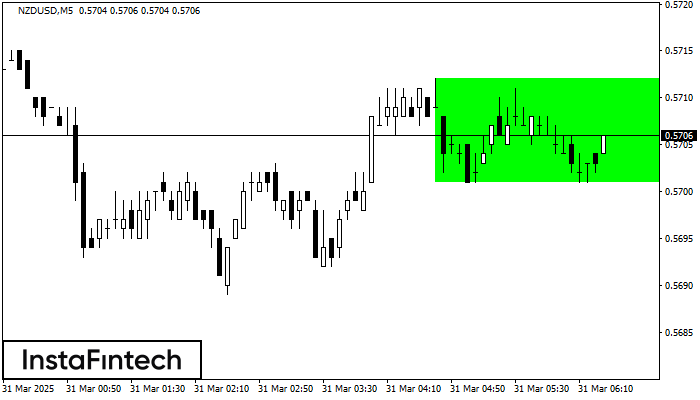
Bullish Rectangle
was formed on 31.03 at 05:26:24 (UTC+0)
signal strength 1 of 5

According to the chart of M5, NZDUSD formed the Bullish Rectangle. This type of a pattern indicates a trend continuation. It consists of two levels: resistance 0.5712 and support 0.5701. In case the resistance level 0.5712 - 0.5712 is broken, the instrument is likely to follow the bullish trend.
The M5 and M15 time frames may have more false entry points.
- All
- All
- Bearish Rectangle
- Bearish Symmetrical Triangle
- Bearish Symmetrical Triangle
- Bullish Rectangle
- Double Top
- Double Top
- Triple Bottom
- Triple Bottom
- Triple Top
- Triple Top
- All
- All
- Buy
- Sale
- All
- 1
- 2
- 3
- 4
- 5
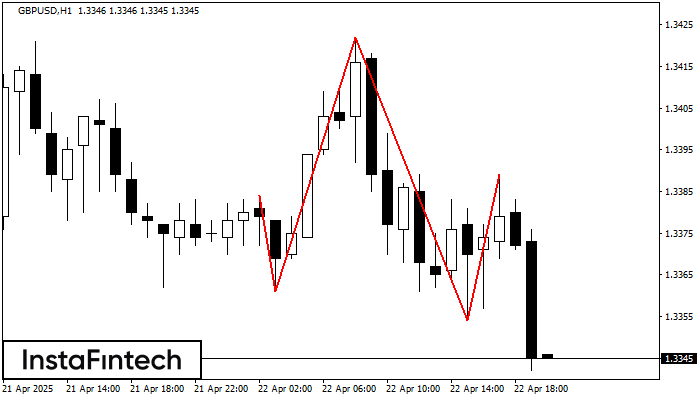
হেড অ্যান্ড শোল্ডার্স
was formed on 22.04 at 19:00:29 (UTC+0)
signal strength 4 of 5
H1 চার্টে, GBPUSD নিম্নলিখিত ফিচারগুলোর সাথে হেড অ্যান্ড শোল্ডার্স প্যাটার্ন তৈরি করেছে: হেডের টপ 1.3422, নেকলাইন এবং ঊর্ধ্বমুখী অ্যাঙ্গেল 1.3361/1.3354-এ রয়েছে। এই প্যাটার্নের গঠন বর্তমান প্রবণতা বুলিশ থেকে বিয়ারিশে পরিবর্তন
Open chart in a new window
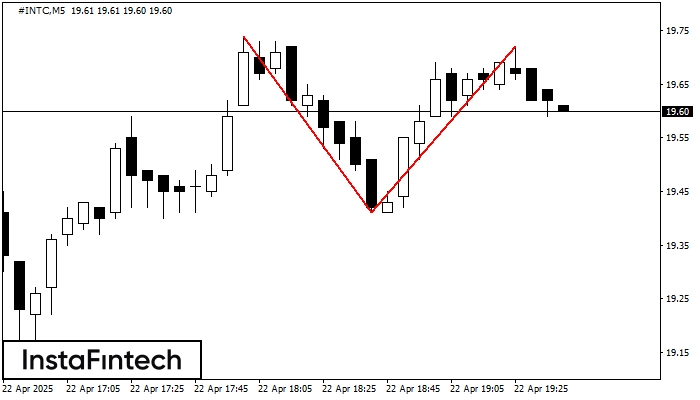
ডাবল টপ
was formed on 22.04 at 18:40:05 (UTC+0)
signal strength 1 of 5
M5 চার্টে, #INTC-এর ডাবল টপ রিভার্সাল বা বিপরীতমুখী প্যাটার্ন গঠিত হয়েছে। বৈশিষ্ট্য: উপরের সীমানা 19.72; নীচের সীমানা 19.41; প্যাটার্নের প্রস্থ 31 পয়েন্ট। সংকেত: নীচের সীমানা ব্রেক করা হলে 19.26 স্তরের
M5 এবং M15 টাইম ফ্রেমে আরও ভুল এন্ট্রি পয়েন্ট থাকতে পারে।
Open chart in a new window
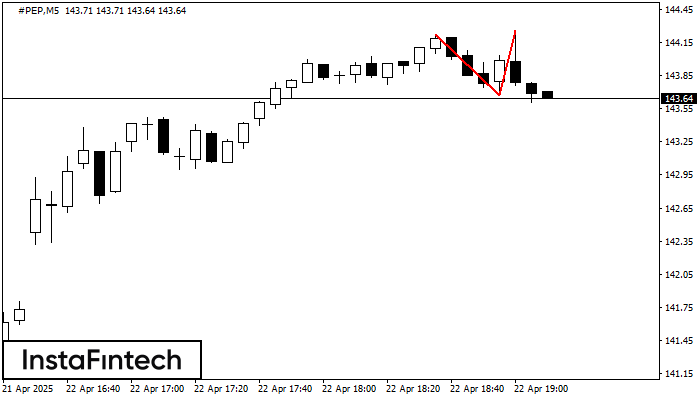
ডাবল টপ
was formed on 22.04 at 18:10:32 (UTC+0)
signal strength 1 of 5
M5 চার্টে, #PEP-এর ডাবল টপ রিভার্সাল বা বিপরীতমুখী প্যাটার্ন গঠিত হয়েছে। বৈশিষ্ট্য: উপরের সীমানা 144.26; নীচের সীমানা 143.67; প্যাটার্নের প্রস্থ 59 পয়েন্ট। সংকেত: নীচের সীমানা ব্রেক করা হলে 143.52 স্তরের
M5 এবং M15 টাইম ফ্রেমে আরও ভুল এন্ট্রি পয়েন্ট থাকতে পারে।
Open chart in a new window


