

অ্যাকচুয়াল প্যাটার্নস

প্যাটার্ন হলো গ্রাফিক্যাল মডেল, যা মূল্য ওঠানামার ভিত্তিতে চার্টে তৈরি হয়। টেকনিক্যাল বিশ্লেষণের নীতি অনুযায়ী, ইতিহাসের (প্রাইস মুভমেন্ট) পুনরাবৃত্তি ঘটে। অর্থাৎ, পরিস্থিতি যদি একই রকম থাকে তাহলে প্রাইস মুভমেন্টও প্রায় একই রকম হয়। এর ফলে মূল্যের ওঠানামা কেমন হবে তা আগেই থেকেই অনুমান করা যায়।
ইন্সটাফরেক্স এর প্রাসঙ্গিক প্যাটার্নসমূহ সহজেই ব্যবহার করা যায়, যার মাধ্যমে মার্কেটের সর্বশেষ পরিস্থিতি জানা যায় এবং তার উপর ভিত্তি করে সিদ্ধান্ত নেওয়া যায়। আমাদের সেবাগুলো থেকে আপনি যেকোনো পেয়ার এবং টাইমফ্রেমের জন্য সর্বশেষ এবং সবচেয়ে প্রাসঙ্গিক প্যাটার্নগুলো খুঁজে পাবেন।
Triple Top
was formed on 29.03 at 23:35:32 (UTC+0)
signal strength 1 of 5

The Triple Top pattern has formed on the chart of the #Bitcoin M5 trading instrument. It is a reversal pattern featuring the following characteristics: resistance level 50, support level -21012, and pattern’s width 47477. Forecast If the price breaks through the support level 82165.38, it is likely to move further down to 82748.85.
The M5 and M15 time frames may have more false entry points.
- All
- All
- Bearish Rectangle
- Bearish Symmetrical Triangle
- Bearish Symmetrical Triangle
- Bullish Rectangle
- Double Top
- Double Top
- Triple Bottom
- Triple Bottom
- Triple Top
- Triple Top
- All
- All
- Buy
- Sale
- All
- 1
- 2
- 3
- 4
- 5
বুলিশ রেক্ট্যাঙ্গেল
was formed on 08.05 at 07:42:13 (UTC+0)
signal strength 1 of 5
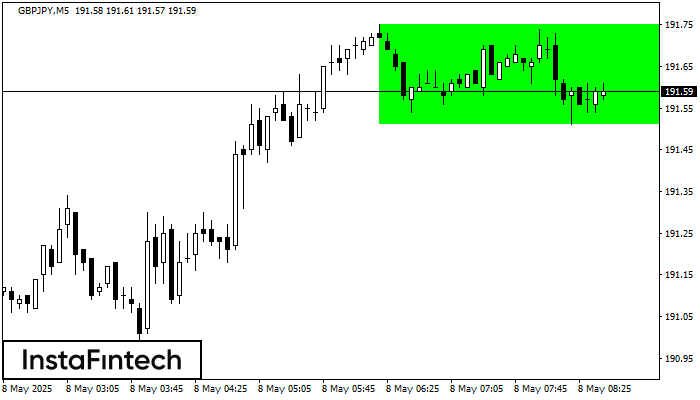
M5 চার্ট অনুযায়ী, GBPJPY বুলিশ রেক্ট্যাঙ্গেল গঠন করেছে। এই প্যাটার্ন চলমান প্রবণতার ধারাবাহিকতা নির্দেশ করে। উপরের সীমানা হল 191.75, নীচের সীমানা হল 191.51৷ এই সংকেতের অর্থ হল বুলিশ রেক্ট্যাঙ্গেল -এর
M5 এবং M15 টাইম ফ্রেমে আরও ভুল এন্ট্রি পয়েন্ট থাকতে পারে।
Open chart in a new window
ট্রিপল টপ
was formed on 08.05 at 07:30:25 (UTC+0)
signal strength 2 of 5
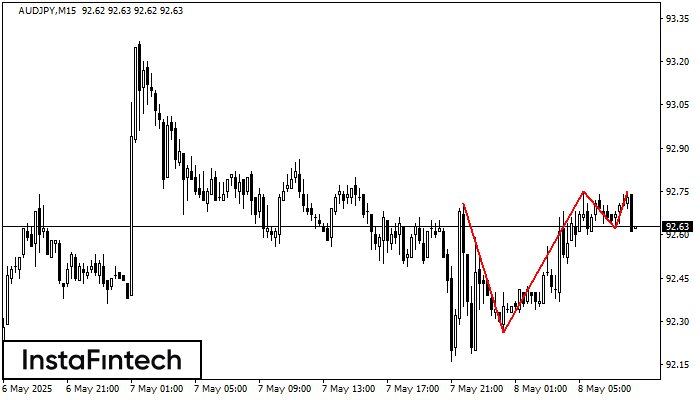
M15 চার্টে, AUDJPY ট্রেডিং ইন্সট্রুমেন্টের ট্রিপল টপ প্যাটার্ন গঠিত হয়েছে। এটি একটি রিভার্সাল বা বিপরীতমুখী প্যাটার্ন যা নিম্নলিখিত বৈশিষ্ট্যগুলিকে সমন্বিত করে: রেজিস্ট্যান্স স্তর -4, সাপোর্ট স্তর -36 এবং প্যাটার্নের প্রস্থ
M5 এবং M15 টাইম ফ্রেমে আরও ভুল এন্ট্রি পয়েন্ট থাকতে পারে।
Open chart in a new window
ট্রিপল টপ
was formed on 08.05 at 07:15:11 (UTC+0)
signal strength 1 of 5
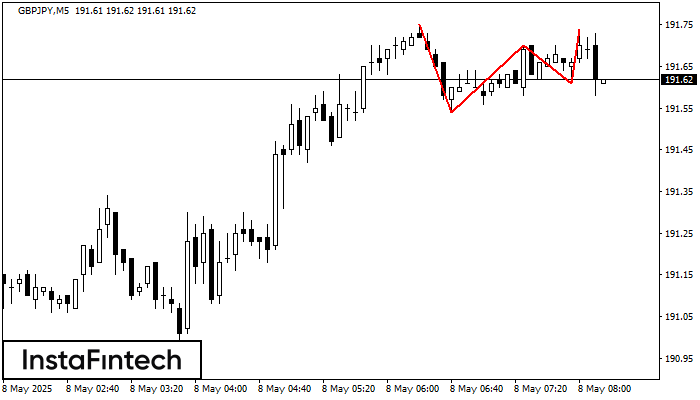
M5 চার্টে, GBPJPY ট্রেডিং ইন্সট্রুমেন্টের ট্রিপল টপ প্যাটার্ন প্রবণতা পরিবর্তনের ইঙ্গিত দেয়। তৃতীয় পিকের গঠনের পরে, মূল্য 191.54-এর রেজিস্ট্যান্স স্তর ভেদ করার প্রচেষ্টা চালানোর সম্ভাবনা রয়েছে, এক্ষেত্রে আমরা সেল করার
M5 এবং M15 টাইম ফ্রেমে আরও ভুল এন্ট্রি পয়েন্ট থাকতে পারে।
Open chart in a new window


