আরও দেখুন


 16.01.2025 02:09 PM
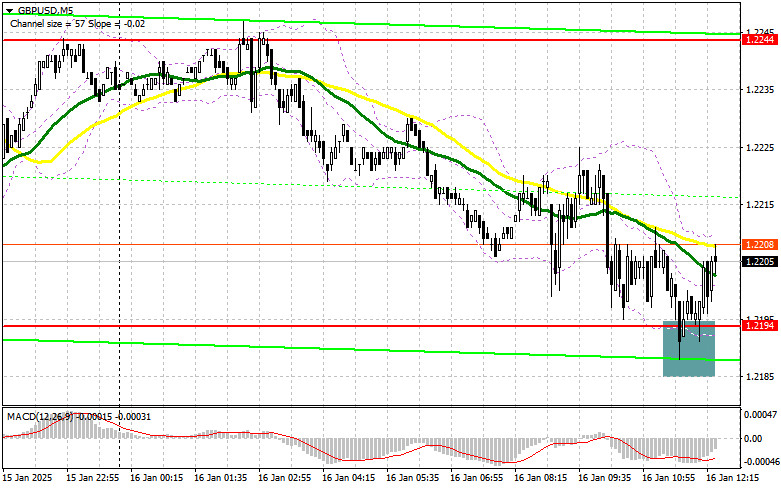
In my morning forecast, I focused on the 1.2194 level and planned to make trading decisions based on its behavior. Let's analyze the 5-minute chart to see what happened. A decline followed by a false breakout at this level provided a good buying opportunity for the pound, which so far has resulted in only a 10-point rise. The technical picture remains unchanged for the second half of the day.
For Opening Long Positions on GBP/USD
News that the UK GDP came in below economists' forecasts triggered selling pressure on the pound, though it didn't lead to a significant drop in the pair. It was evident that the UK economy was going through challenging times, so there were no expectations of extraordinary results for the end of last year. Consequently, the market did not react strongly to the weak data.
The second half of the day should be more eventful, with weekly initial jobless claims and the December retail sales report from the US on the agenda. Weak data could restore confidence in the pound, while strong numbers would renew pressure on GBP/USD.
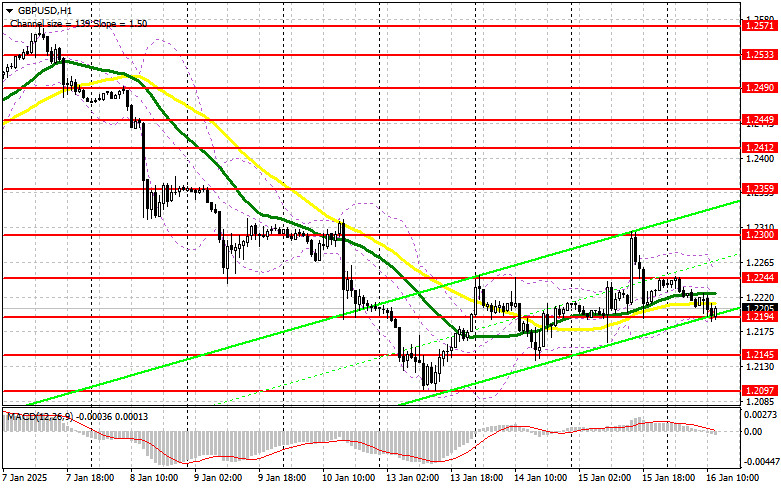
If the pair declines, I will act only after a false breakout around the nearest support at 1.2194, similar to this morning's scenario. The target would be a recovery towards 1.2244 resistance, which was not tested earlier today. A breakout and subsequent retest of this range could create a new entry point for long positions, targeting 1.2300. Buyers are likely to encounter more significant challenges at this level. The ultimate target will be 1.2359, where I plan to take profits.
If GBP/USD falls further and bulls fail to defend 1.2194, the pair may decline more significantly. In this case, I'll wait for a false breakout near the 1.2145 low to consider long positions. Alternatively, I'll open long positions on a rebound from 1.2097, targeting an intraday correction of 30–35 points.
For Opening Short Positions on GBP/USD
Pound sellers tried but failed to take control of 1.2194. However, buyers are not showing much activity either, keeping the potential for further declines intact.
For the second half of the day, it's best to wait for a test of 1.2244, which could occur if US data comes in weak. A false breakout at this level would offer a good selling opportunity, targeting a return to 1.2194 support, where the moving averages—favoring the bulls—are situated, making this area important.
A break and retest below 1.2194 could lead to stop-loss orders being triggered, paving the way for 1.2145 and signaling a stronger bearish market. The ultimate target will be 1.2097, where I'll take profits.
If demand for the pound strengthens later in the day and bears fail to show activity at 1.2244, I'll delay selling until the pair tests the 1.2300 resistance. I'll sell there only after a false breakout. If there's no downward movement from that level, I'll look for short positions on a rebound near 1.2359, aiming for an intraday correction of 30–35 points.
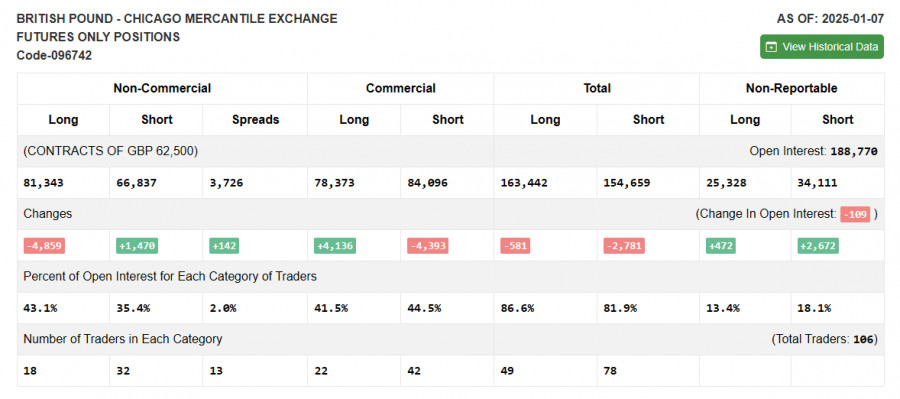
The Commitments of Traders (COT) report for January 7 showed a rise in short positions and a reduction in long ones. Overall, the balance of power has not changed significantly, and the pound, despite the prevalence of bullish positions, continues to lose ground against the US dollar.
Upcoming UK inflation and GDP data may complicate the Bank of England's future decisions, reducing the likelihood of a significant rally in GBP/USD. The report indicated that long non-commercial positions fell by 4,859 to 81,343, while short non-commercial positions increased by 1,470 to 66,837. The net position difference grew by 142.
Moving AveragesTrading is occurring around the 30- and 50-day moving averages, indicating market uncertainty.Note: The moving averages are based on the H1 hourly chart and differ from the D1 daily chart.
Bollinger Bands:Support is expected near the lower boundary at 1.2194 in case of a decline.
You have already liked this post today
*এখানে পোস্ট করা মার্কেট বিশ্লেষণ আপনার সচেতনতা বৃদ্ধির জন্য প্রদান করা হয়, ট্রেড করার নির্দেশনা প্রদানের জন্য প্রদান করা হয় না।
মঙ্গলবারের ট্রেডের বিশ্লেষণ GBP/USD পেয়ারের 1H চার্ট মঙ্গলবার GBP/USD পেয়ারের সামান্য দরপতন হয়েছে, যা সম্ভবত শুধুমাত্র টেকনিক্যাল কারণেই ঘটেছে। এমনকি ঘণ্টাভিত্তিক টাইমফ্রেমেও স্পষ্টভাবে দেখা যাচ্ছে যে ব্রিটিশ পাউন্ডের মূল্য খুব
মঙ্গলবারের ট্রেডের বিশ্লেষণ EUR/USD পেয়ারের 1H চার্ট মঙ্গলবার নিম্নমুখী প্রবণতার মধ্যেই EUR/USD কারেন্সি পেয়ারের ট্রেডিং চলমান ছিল। ইচ্ছা করলে, মার্কিন ডলারের মূল্যের মাত্র ৫০ পিপসের ঊর্ধ্বমুখী মুভমেন্টের পেছনে সহজেই যুক্তিসঙ্গত
সোমবারের ট্রেডের বিশ্লেষণ GBP/USD পেয়ারের 1H চার্ট সোমবার GBP/USD পেয়ারেরও ঊর্ধ্বমুখী প্রবণতার সাথে ট্রেডিং করা হয়েছে। তবে ব্রিটিশ পাউন্ডের সামগ্রিক টেকনিক্যাল চিত্র ইউরোর তুলনায় কিছুটা আলাদা। হ্যাঁ, পাউন্ডের মূল্যও ইউরোর
সোমবারের ট্রেডের বিশ্লেষণ EUR/USD পেয়ারের 1H চার্ট সোমবার ঊর্ধ্বমুখী প্রবণতার সাথে EUR/USD কারেন্সি পেয়ারের ট্রেড করা হয়েছে। আমরা পূর্বেই সতর্ক করেছিলাম যে ডোনাল্ড ট্রাম্প কর্তৃক স্টিল ও অ্যালুমিনিয়াম আমদানির
শুক্রবারের ট্রেডের বিশ্লেষণ GBP/USD পেয়ারের 1H চার্ট শুক্রবার পুরো দিনজুড়েই তুলনামূলক স্থিতিশীলভাবে GBP/USD পেয়ারের ট্রেডিং পরিলক্ষিত হয়েছে। সেদিন কোনো গুরুত্বপূর্ণ খবর বা ইভেন্ট ছিল না, ফলে এই পেয়ারের মূল্যের অস্থিরতার
শুক্রবারের ট্রেডের বিশ্লেষণ EUR/USD পেয়ারের 1H চার্ট বৃহস্পতিবারের তুলনায় শুক্রবার অনেকটাই স্থিতিশীলভাবে EUR/USD কারেন্সি পেয়ারের ট্রেডিং পরিলক্ষিত হয়েছে। এটি মোটেও অপ্রত্যাশিত পরিস্থিতি ছিল না, কারণ সামষ্টিক অর্থনৈতিক প্রেক্ষাপটের প্রভাব দুর্বল
বৃহস্পতিবারের ট্রেডের বিশ্লেষণ GBP/USD পেয়ারের 1H চার্ট বৃহস্পতিবার EUR/USD পেয়ারের মতোই GBP/USD পেয়ারের মূল্যের মুভমেন্ট দেখা গেছে, তবে তুলনামূলকভাবে অস্থিরতার মাত্রা কম ছিল। এই পেয়ারের মূল্য অ্যাসেন্ডিং ট্রেন্ডলাইনটি ব্রেক করেছে
বৃহস্পতিবারের ট্রেডের বিশ্লেষণ EUR/USD পেয়ারের 1H চার্ট বৃহস্পতিবার দিনের শুরুতে EUR/USD কারেন্সি পেয়ার তীব্র দরপতনের শিকার হয়, তবে দিনের বাকি সময়টিতে শক্তিশালী ঊর্ধ্বমুখী প্রবণতার সাথে ট্রেড করা হয়েছে। বৃহস্পতিবার
বৃহস্পতিবার EUR/USD পেয়ারের তুলনায় GBP/USD কারেন্সি পেয়ারের মূল্যের অপেক্ষাকৃত স্বল্প মাত্রার অস্থিরতা দেখা গেছে, যা কিছুটা বিস্ময়কর। একই সময়ে, ব্রিটিশ পাউন্ডের মূল্য খুব বেশি ঝামেলা ছাড়াই ক্রিটিক্যাল লাইনের দিকে ফিরে
বৃহস্পতিবার রাতের দিকে EUR/USD পেয়ার তীব্র দরপতনের শিকার হয়, তবে দিনের বাকি সময়জুড়ে এই পেয়ারের মূল্য তিনগুণ বেশি শক্তিশালীভাবে ঊর্ধ্বমুখী রিবাউন্ড করে। রাতের বেলা এই পেয়ারের মূল্যের এই দিক পরিবর্তনের
Forex Chart
Web-version

Your IP address shows that you are currently located in the USA. If you are a resident of the United States, you are prohibited from using the services of InstaFintech Group including online trading, online transfers, deposit/withdrawal of funds, etc.
If you think you are seeing this message by mistake and your location is not the US, kindly proceed to the website. Otherwise, you must leave the website in order to comply with government restrictions.
Why does your IP address show your location as the USA?
Please confirm whether you are a US resident or not by clicking the relevant button below. If you choose the wrong option, being a US resident, you will not be able to open an account with InstaTrade anyway.
We are sorry for any inconvenience caused by this message.


