আরও দেখুন

 22.10.2024 04:54 PM
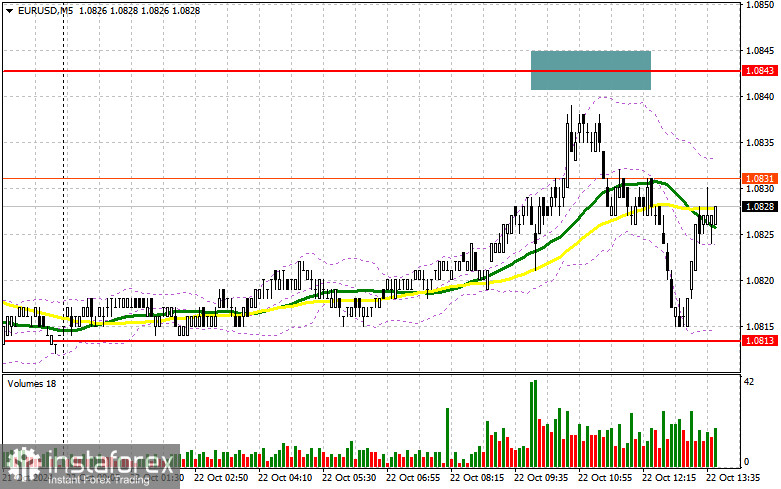
In my morning forecast, I focused on the 1.0843 level and planned to make trading decisions from there. Let us examine the 5-minute chart to see what happened. The rise to the 1.0843 level took place, but the pair fell a few points short of testing this level, so I missed suitable entry points. A similar situation occurred with the 1.0813 level, where the pair failed to reach the target. The technical outlook for the second half of the day has not been revised.
To open long positions on EUR/USD:
In the second half of the day, there is no significant data, and the Richmond Fed Manufacturing Index data holds little value. We might hear something new from FOMC member Patrick T. Harker's interview, who, like most of his colleagues, may advocate for a more cautious rate-cut approach, providing additional support to the US dollar and weakening the euro's position. If the pair responds with a decline to these statements, I will take action only around the support at 1.0813, which was not reached earlier today. A false breakout here would be a suitable condition for initiating long positions, opening the way back to the 1.0843 level. A breakout and retest of this range would confirm a valid buying point with the target of reaching 1.0871. The ultimate target would be the 1.0900 level, where I will take profits. If, in the second half of the day, EUR/USD declines and there is no buying activity around 1.0813, pressure on the euro will persist within the trend, creating significant challenges for buyers. In such a case, I would consider entering long positions only after a false breakout around the next support at 1.0783. I plan to open long positions immediately on a rebound from 1.0761, targeting a 30 to 35 point upward correction during the day.
To open short positions on EUR/USD:
Despite the euro's attempted growth in the first half of the day, sellers quickly made their presence felt, although they failed to reach the monthly low. If another rise occurs, only a false breakout around 1.0843, where the moving averages favor sellers, would provide an entry point for new short positions with a further decline toward support at 1.0813. A breakdown and subsequent consolidation below this range, followed by a retest from below, would offer another suitable selling opportunity, aiming for a move toward 1.0783, further strengthening the bearish market. I expect to see more active buying interest only at this level. The ultimate target would be the 1.0761 level, where I will take profits. If EUR/USD moves up in the second half of the day and sellers remain absent around 1.0843—the middle of the sideways range—buyers will have an opportunity to push for a rebound. In this case, I will delay selling until the next resistance at 1.0871 is tested. I also plan to sell there, but only after an unsuccessful consolidation. I plan to open short positions immediately on a rebound from 1.0910, targeting a 30 to 35 point downward correction.
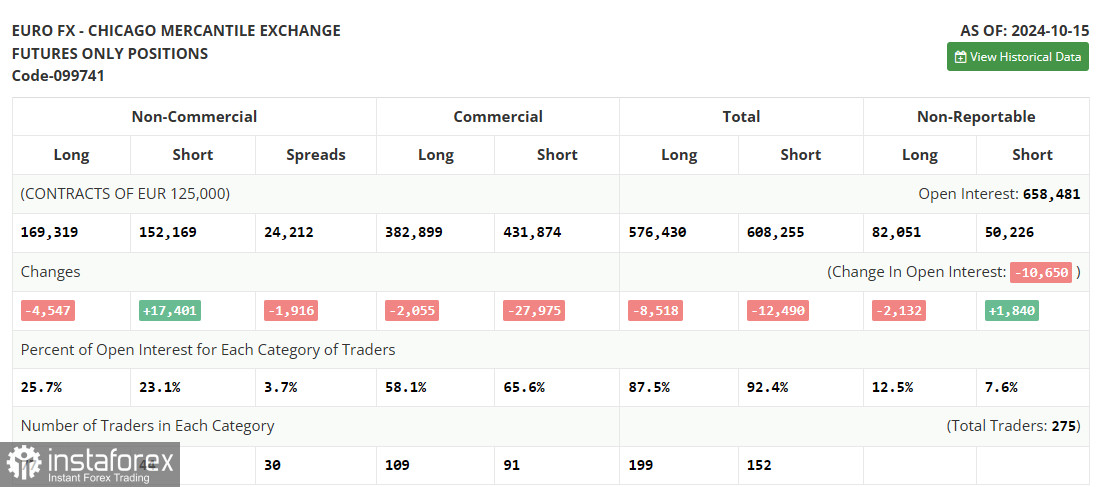
The COT (Commitment of Traders) report from October 15 shows a sharp increase in short positions and a further reduction in long positions. It is clear that the data already reflect the recent European Central Bank decision to cut rates, and the focus on more aggressive policy easing by the end of the year has evidently shifted the balance of power in the market. Now, risk asset buyers are no longer as dominant, with the balance almost equal: 169,319 long positions versus 152,169 short positions. This week promises to be relatively calm, with little important data, so the euro remains oriented toward a bearish market. The COT report shows that long non-commercial positions decreased by 4,547 to 169,319, while short non-commercial positions rose by 17,401 to 152,169, resulting in a decrease in the gap between long and short positions by 1,402.
Indicator Signals:
Moving Averages:
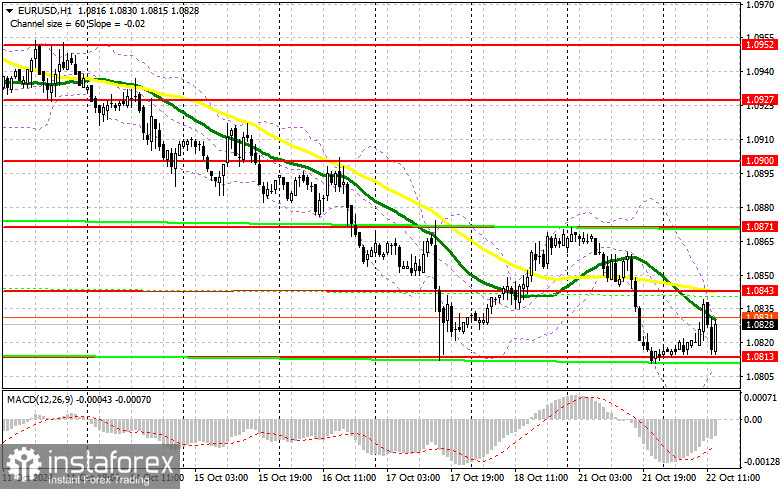
Trading is around the 30- and 50-day moving averages, indicating market uncertainty.
Note: The period and prices of the moving averages are based on the author's analysis on the H1 hourly chart and differ from the standard definition of classic daily moving averages on the D1 daily chart.
Bollinger Bands:
In case of a decline, the lower boundary of the indicator at around 1.0813 will act as support.
Indicator Descriptions:
You have already liked this post today
*এখানে পোস্ট করা মার্কেট বিশ্লেষণ আপনার সচেতনতা বৃদ্ধির জন্য প্রদান করা হয়, ট্রেড করার নির্দেশনা প্রদানের জন্য প্রদান করা হয় না।


