

النماذج الفعلية

النماذج هي نماذج رسومية تتشكل في الرسم البياني حسب السعر. وفقا لأحد المسلمات التحليلية الفنية، فإن التاريخ (حركة السعر) يكرر نفسه. ويعني ذلك أن حركات الأسعار غالباً ما تكون متشابهة في نفس الأوضاع مما يجعل من الممكن التنبؤ بزيادة تطوير الوضع الذي يتسم باحتمال كبير.
النماذج ذات الصلة المقدمة من قبل إنستافوركس هي خدمة سهلة الاستخدام تسمح لك بمعرفة التغييرات الأخيرة في السوق والرد على الأدلة من السوق في الوقت المناسب. في خدمتنا، ستجد دائمًا النماذج الأكثر حداثة وملاءمة في أي زوج وأي إطار زمني.
Double Top
was formed on 14.04 at 19:00:31 (UTC+0)
signal strength 1 of 5
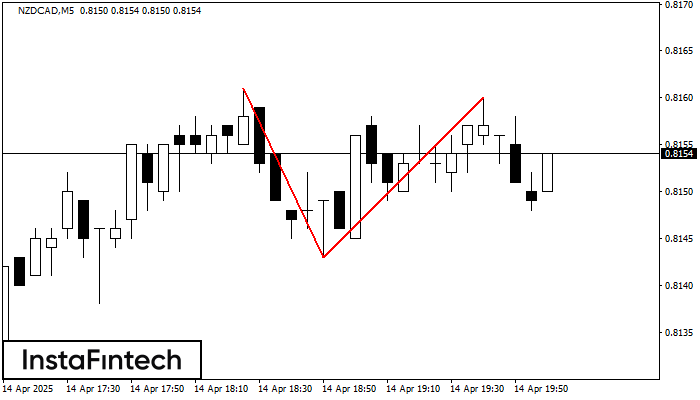
The Double Top reversal pattern has been formed on NZDCAD M5. Characteristics: the upper boundary 0.8161; the lower boundary 0.8143; the width of the pattern is 17 points. Sell trades are better to be opened below the lower boundary 0.8143 with a possible movements towards the 0.8128 level.
The M5 and M15 time frames may have more false entry points.
انظر أيضا
- All
- All
- Bearish Rectangle
- Bearish Symmetrical Triangle
- Bearish Symmetrical Triangle
- Bullish Rectangle
- Double Top
- Double Top
- Triple Bottom
- Triple Bottom
- Triple Top
- Triple Top
- All
- All
- Buy
- Sale
- All
- 1
- 2
- 3
- 4
- 5
Head and Shoulders
сформирован 12.05 в 08:15:31 (UTC+0)
сила сигнала 2 из 5
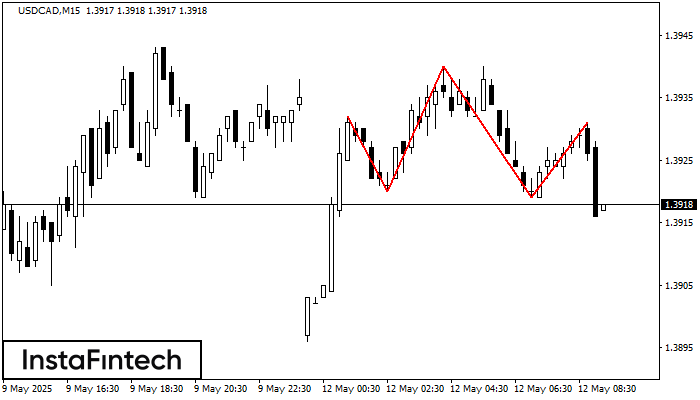
According to the chart of M15, USDCAD formed the Head and Shoulders pattern. The Head’s top is set at 1.3940 while the median line of the Neck is found
The M5 and M15 time frames may have more false entry points.
Открыть график инструмента в новом окне
Triple Bottom
сформирован 12.05 в 07:50:32 (UTC+0)
сила сигнала 1 из 5
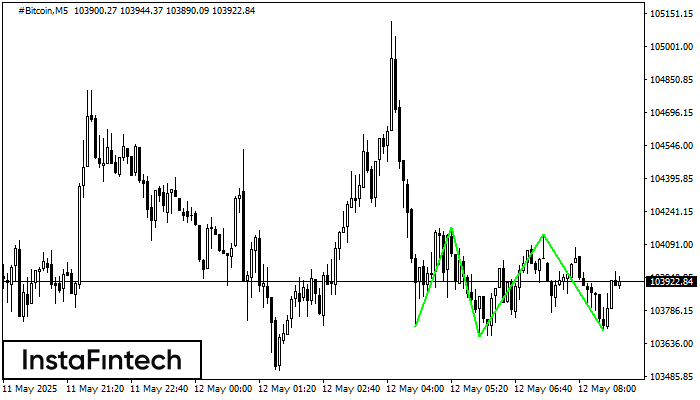
The Triple Bottom pattern has been formed on #Bitcoin M5. It has the following characteristics: resistance level 104168.40/104135.14; support level 103711.95/103696.30; the width is 45645 points. In the event
The M5 and M15 time frames may have more false entry points.
Открыть график инструмента в новом окне
Bullish Symmetrical Triangle
сформирован 12.05 в 07:45:41 (UTC+0)
сила сигнала 1 из 5
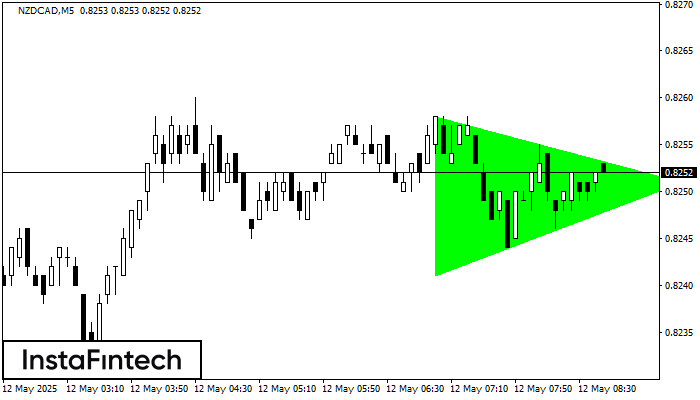
According to the chart of M5, NZDCAD formed the Bullish Symmetrical Triangle pattern. Description: This is the pattern of a trend continuation. 0.8258 and 0.8241 are the coordinates
The M5 and M15 time frames may have more false entry points.
Открыть график инструмента в новом окне
