

النماذج الفعلية

النماذج هي نماذج رسومية تتشكل في الرسم البياني حسب السعر. وفقا لأحد المسلمات التحليلية الفنية، فإن التاريخ (حركة السعر) يكرر نفسه. ويعني ذلك أن حركات الأسعار غالباً ما تكون متشابهة في نفس الأوضاع مما يجعل من الممكن التنبؤ بزيادة تطوير الوضع الذي يتسم باحتمال كبير.
النماذج ذات الصلة المقدمة من قبل إنستافوركس هي خدمة سهلة الاستخدام تسمح لك بمعرفة التغييرات الأخيرة في السوق والرد على الأدلة من السوق في الوقت المناسب. في خدمتنا، ستجد دائمًا النماذج الأكثر حداثة وملاءمة في أي زوج وأي إطار زمني.
Triple Top
was formed on 14.04 at 18:00:31 (UTC+0)
signal strength 3 of 5
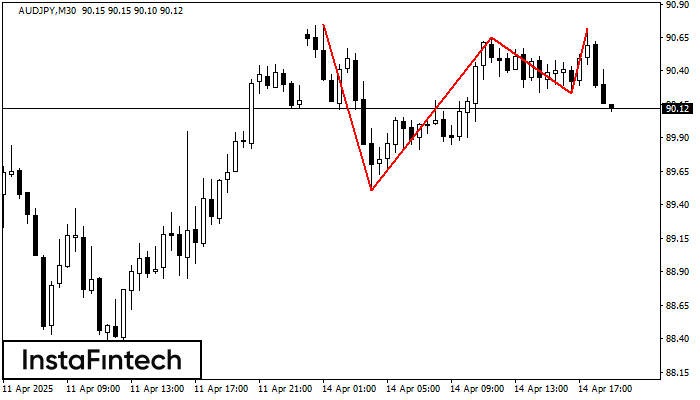
On the chart of the AUDJPY M30 trading instrument, the Triple Top pattern that signals a trend change has formed. It is possible that after formation of the third peak, the price will try to break through the resistance level 89.51, where we advise to open a trading position for sale. Take profit is the projection of the pattern’s width, which is 124 points.
- All
- All
- Bearish Rectangle
- Bearish Symmetrical Triangle
- Bearish Symmetrical Triangle
- Bullish Rectangle
- Double Top
- Double Top
- Triple Bottom
- Triple Bottom
- Triple Top
- Triple Top
- All
- All
- Buy
- Sale
- All
- 1
- 2
- 3
- 4
- 5
Head and Shoulders
was formed on 14.05 at 08:30:22 (UTC+0)
signal strength 3 of 5
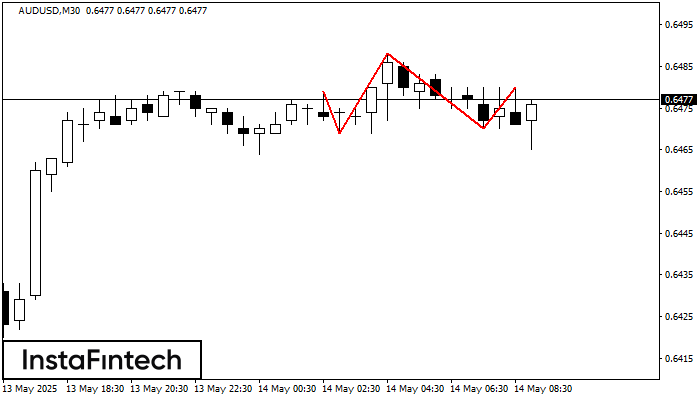
According to the chart of M30, AUDUSD formed the Head and Shoulders pattern. The Head’s top is set at 0.6488 while the median line of the Neck is found
Open chart in a new window
Head and Shoulders
was formed on 14.05 at 08:15:39 (UTC+0)
signal strength 2 of 5
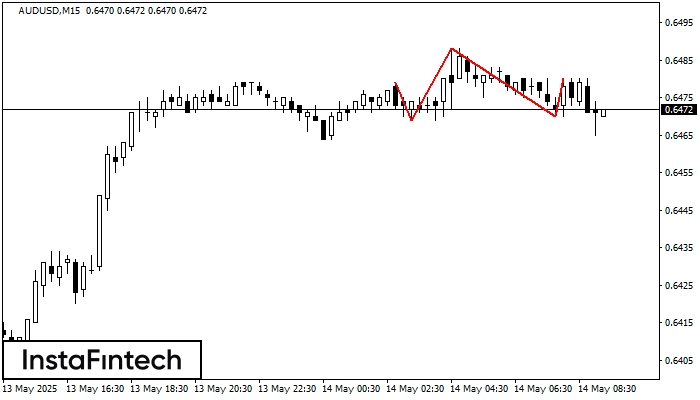
The technical pattern called Head and Shoulders has appeared on the chart of AUDUSD M15. There are weighty reasons to suggest that the price will surpass the Neckline 0.6469/0.6470 after
The M5 and M15 time frames may have more false entry points.
Open chart in a new window
Bullish Rectangle
was formed on 14.05 at 07:47:39 (UTC+0)
signal strength 3 of 5
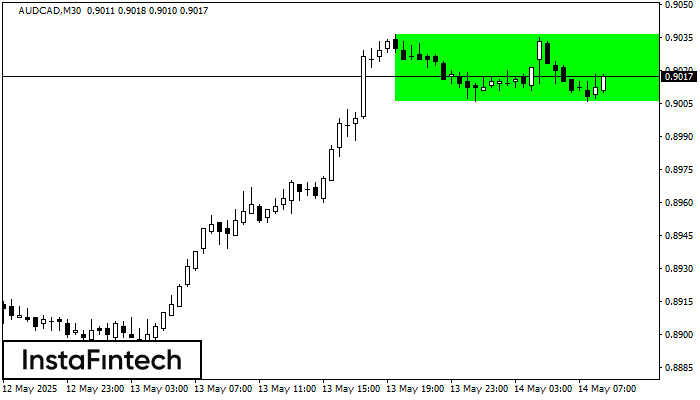
According to the chart of M30, AUDCAD formed the Bullish Rectangle. This type of a pattern indicates a trend continuation. It consists of two levels: resistance 0.9036 and support 0.9006
Open chart in a new window


