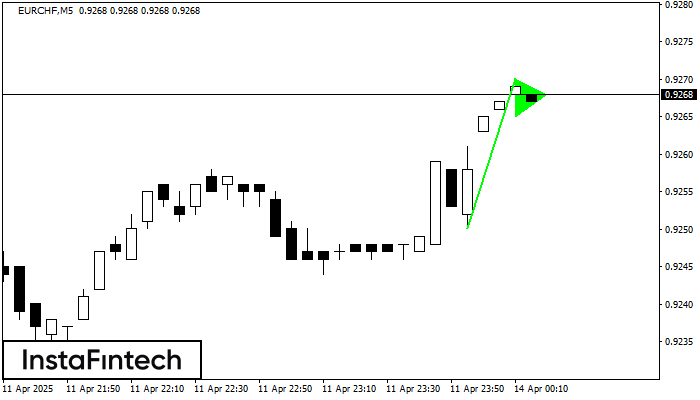
Bullish pennant
was formed on 13.04 at 23:20:14 (UTC+0)
signal strength 1 of 5

The Bullish pennant pattern is formed on the EURCHF M5 chart. It is a type of the continuation pattern. Supposedly, in case the price is fixed above the pennant’s high of 0.9270, a further uptrend is possible.
The M5 and M15 time frames may have more false entry points.
انظر أيضا
- All
- All
- Bearish Rectangle
- Bearish Symmetrical Triangle
- Bearish Symmetrical Triangle
- Bullish Rectangle
- Double Top
- Double Top
- Triple Bottom
- Triple Bottom
- Triple Top
- Triple Top
- All
- All
- Buy
- Sale
- All
- 1
- 2
- 3
- 4
- 5
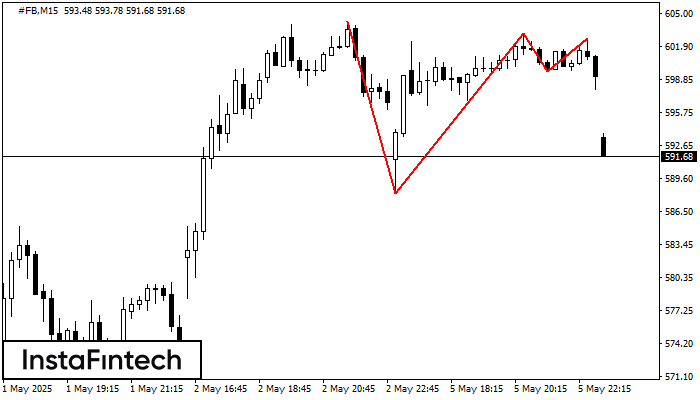
ट्रिपल टॉप
was formed on 06.05 at 15:30:55 (UTC+0)
signal strength 2 of 5
#FB M15 के चार्ट पर ट्रिपल टॉप पैटर्न बना है। पैटर्न की विशेषताएं: सीमाओं में एक आरोही कोण मौजूद है; पैटर्न की निचली रेखा 588.21/599.57 पर है और ऊपरी सीमा
M5 और M15 समय सीमा में अधिक फाल्स एंट्री पॉइंट्स हो सकते हैं।
Open chart in a new window
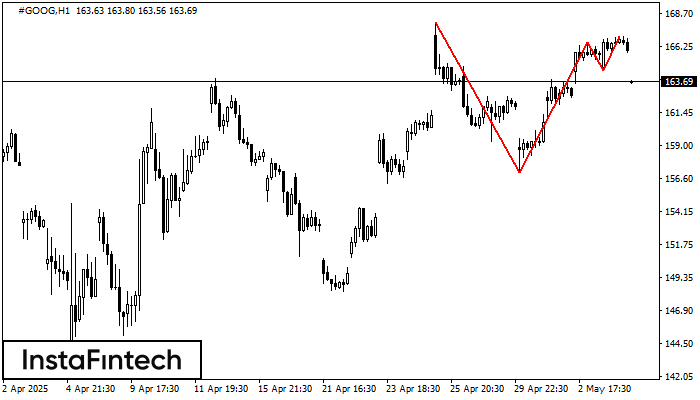
ट्रिपल टॉप
was formed on 06.05 at 15:30:28 (UTC+0)
signal strength 4 of 5
#GOOG H1 के चार्ट पर ट्रिपल टॉप पैटर्न बना है। पैटर्न की विशेषताएं: सीमाओं में एक आरोही कोण मौजूद है; पैटर्न की निचली रेखा 157.06/164.52 पर है और ऊपरी सीमा
Open chart in a new window
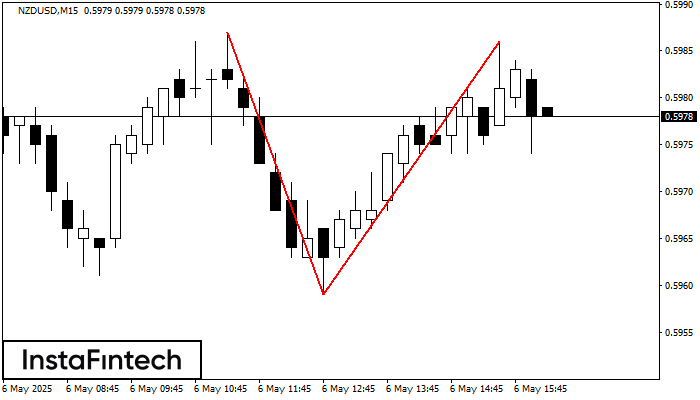
डबल टॉप
was formed on 06.05 at 15:15:53 (UTC+0)
signal strength 2 of 5
NZDUSD M15 पर डबल टॉप रीवर्सल पैटर्न बना है। विशेषताएं: ऊपरी सीमा 0.5987; निचली सीमा 0.5959; पैटर्न की चौड़ाई 27 पॉइंट्स है। सेल ट्रेडों को 0.5959 की निचली सीमा के
M5 और M15 समय सीमा में अधिक फाल्स एंट्री पॉइंट्स हो सकते हैं।
Open chart in a new window


