

النماذج الفعلية

النماذج هي نماذج رسومية تتشكل في الرسم البياني حسب السعر. وفقا لأحد المسلمات التحليلية الفنية، فإن التاريخ (حركة السعر) يكرر نفسه. ويعني ذلك أن حركات الأسعار غالباً ما تكون متشابهة في نفس الأوضاع مما يجعل من الممكن التنبؤ بزيادة تطوير الوضع الذي يتسم باحتمال كبير.
النماذج ذات الصلة المقدمة من قبل إنستافوركس هي خدمة سهلة الاستخدام تسمح لك بمعرفة التغييرات الأخيرة في السوق والرد على الأدلة من السوق في الوقت المناسب. في خدمتنا، ستجد دائمًا النماذج الأكثر حداثة وملاءمة في أي زوج وأي إطار زمني.
Inverse Head and Shoulder
was formed on 09.04 at 15:29:43 (UTC+0)
signal strength 3 of 5
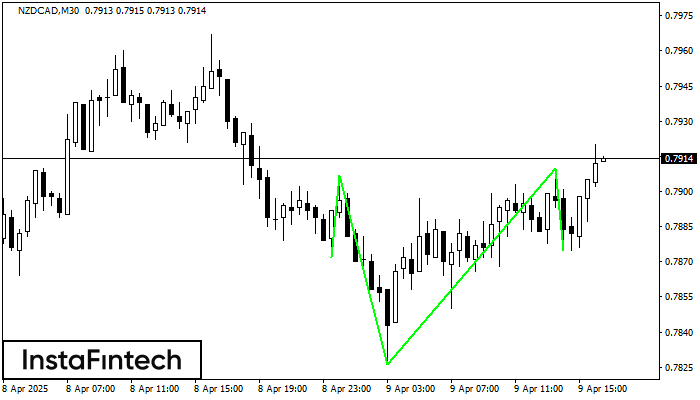
According to the chart of M30, NZDCAD formed the Inverse Head and Shoulder pattern. The Head’s top is set at 0.7910 while the median line of the Neck is found at 0.7826/0.7875. The formation of the Inverse Head and Shoulder pattern evidently signals a reversal of the downward trend. In other words, in case the scenario comes true, the price of NZDCAD will go towards 0.7940
- All
- All
- Bearish Rectangle
- Bearish Symmetrical Triangle
- Bearish Symmetrical Triangle
- Bullish Rectangle
- Double Top
- Double Top
- Triple Bottom
- Triple Bottom
- Triple Top
- Triple Top
- All
- All
- Buy
- Sale
- All
- 1
- 2
- 3
- 4
- 5
Double Top
was formed on 09.05 at 02:15:13 (UTC+0)
signal strength 2 of 5
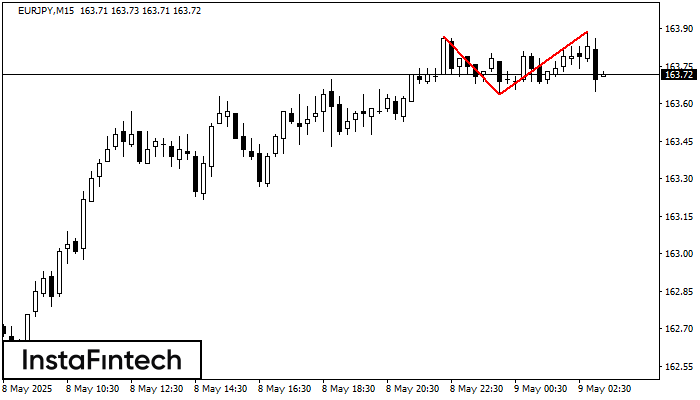
Pada carta EURJPY M15 corak pembalikan Double Top telah terbentuk. Ciri-ciri: sempadan atas 163.89; sempadan bawah 163.64; lebar corak 25 mata. Isyarat: penembusan sempadan bawah akan menyebabkan kesinambungan arah aliran
Carta masa M5 dan M15 mungkin mempunyai lebih banyak titik kemasukan palsu.
Open chart in a new window
Double Top
was formed on 09.05 at 02:09:54 (UTC+0)
signal strength 1 of 5
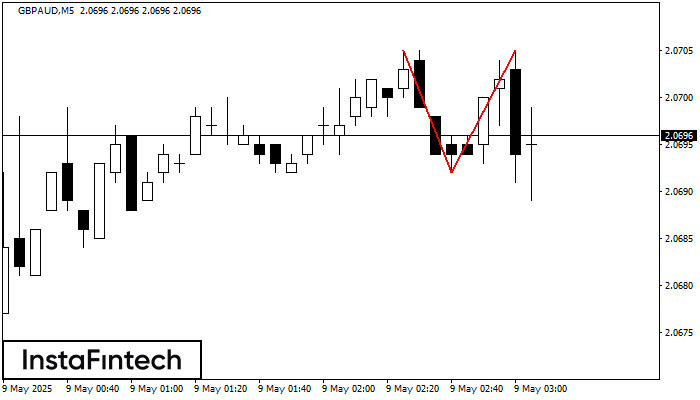
Pada carta GBPAUD M5 corak pembalikan Double Top telah terbentuk. Ciri-ciri: sempadan atas 2.0705; sempadan bawah 2.0692; lebar corak 13 mata. Isyarat: penembusan sempadan bawah akan menyebabkan kesinambungan arah aliran
Carta masa M5 dan M15 mungkin mempunyai lebih banyak titik kemasukan palsu.
Open chart in a new window
Triple Bottom
was formed on 09.05 at 01:00:28 (UTC+0)
signal strength 4 of 5
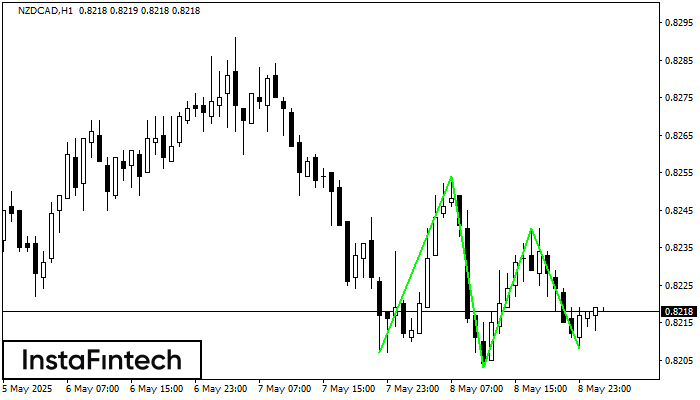
Corak Triple Bottom telah dibentuk pada carta NZDCAD H1. Ciri-ciri corak: Garisan bawah corak mempunyai koordinat 0.8254 dengan had atas 0.8254/0.8240, unjuran lebar adalah 47 mata. Pembentukan corak Triple Bottom
Open chart in a new window


