

النماذج الفعلية

النماذج هي نماذج رسومية تتشكل في الرسم البياني حسب السعر. وفقا لأحد المسلمات التحليلية الفنية، فإن التاريخ (حركة السعر) يكرر نفسه. ويعني ذلك أن حركات الأسعار غالباً ما تكون متشابهة في نفس الأوضاع مما يجعل من الممكن التنبؤ بزيادة تطوير الوضع الذي يتسم باحتمال كبير.
النماذج ذات الصلة المقدمة من قبل إنستافوركس هي خدمة سهلة الاستخدام تسمح لك بمعرفة التغييرات الأخيرة في السوق والرد على الأدلة من السوق في الوقت المناسب. في خدمتنا، ستجد دائمًا النماذج الأكثر حداثة وملاءمة في أي زوج وأي إطار زمني.
Bearish pennant
was formed on 04.04 at 16:11:55 (UTC+0)
signal strength 1 of 5
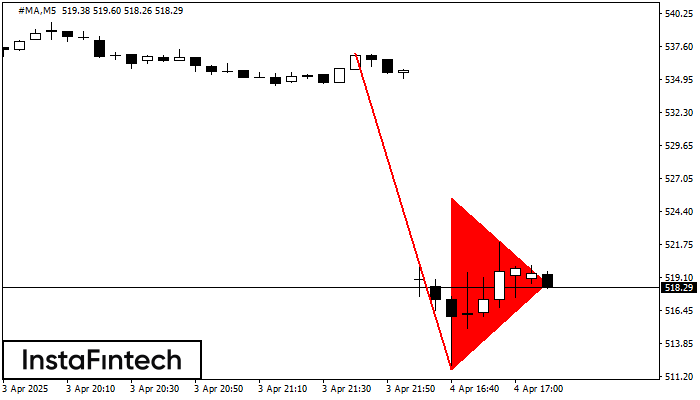
The Bearish pennant pattern has formed on the #MA M5 chart. This pattern type is characterized by a slight slowdown after which the price will move in the direction of the original trend. In case the price fixes below the pattern’s low of 511.79, a trader will be able to successfully enter the sell position.
The M5 and M15 time frames may have more false entry points.
انظر أيضا
- All
- All
- Bearish Rectangle
- Bearish Symmetrical Triangle
- Bearish Symmetrical Triangle
- Bullish Rectangle
- Double Top
- Double Top
- Triple Bottom
- Triple Bottom
- Triple Top
- Triple Top
- All
- All
- Buy
- Sale
- All
- 1
- 2
- 3
- 4
- 5
Triângulo Simétrico de Baixa
was formed on 12.05 at 03:30:12 (UTC+0)
signal strength 3 of 5
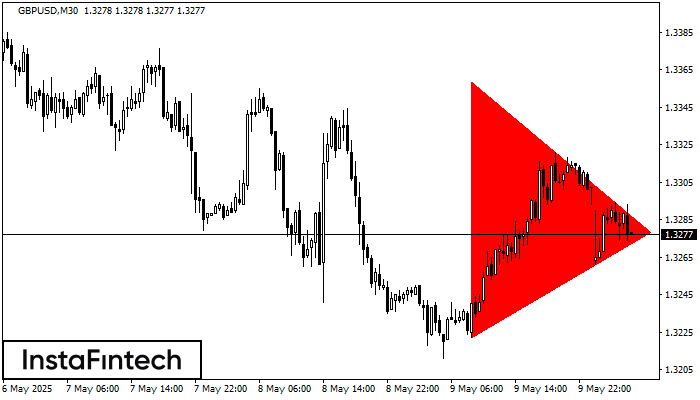
De acordo com o gráfico de M30, GBPUSD formou o padrão de Triângulo Simétrico de Baixa. Recomendações de negociação: Uma quebra do limite inferior de 1.3222 pode encorajar a continuação
Open chart in a new window
Pennant de alta
was formed on 12.05 at 01:42:06 (UTC+0)
signal strength 3 of 5
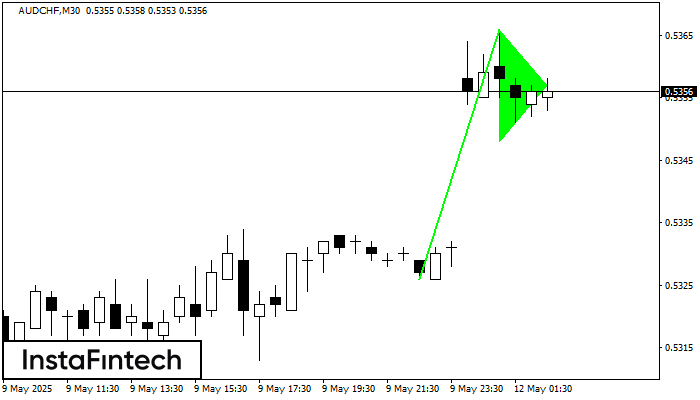
O padrão gráfico Pennant de alta foi formado no instrumento AUDCHF M30. Esse tipo de padrão se enquadra na categoria de padrões de continuação. Neste caso, se a cotação conseguir
Open chart in a new window
Topo duplo
was formed on 12.05 at 01:35:35 (UTC+0)
signal strength 1 of 5
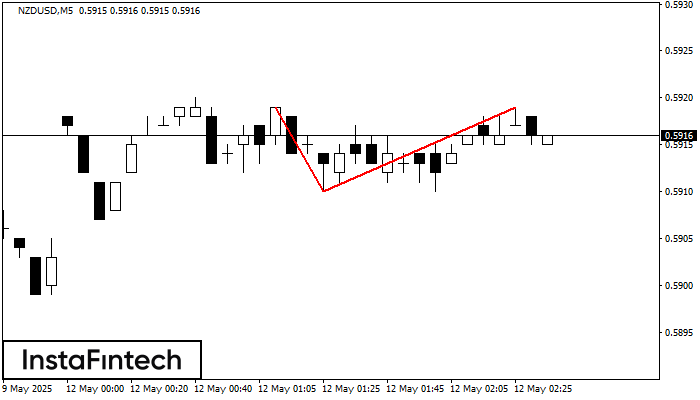
No gráfico de NZDUSD M5 o padrão de reversão Topo duplo foi formado. Características: o limite superior 0.5919; o limite inferior 0.5910; a largura do padrão 9 pontos. O sinal
Os intervalos M5 e M15 podem ter mais pontos de entrada falsos.
Open chart in a new window


