

النماذج الفعلية

النماذج هي نماذج رسومية تتشكل في الرسم البياني حسب السعر. وفقا لأحد المسلمات التحليلية الفنية، فإن التاريخ (حركة السعر) يكرر نفسه. ويعني ذلك أن حركات الأسعار غالباً ما تكون متشابهة في نفس الأوضاع مما يجعل من الممكن التنبؤ بزيادة تطوير الوضع الذي يتسم باحتمال كبير.
النماذج ذات الصلة المقدمة من قبل إنستافوركس هي خدمة سهلة الاستخدام تسمح لك بمعرفة التغييرات الأخيرة في السوق والرد على الأدلة من السوق في الوقت المناسب. في خدمتنا، ستجد دائمًا النماذج الأكثر حداثة وملاءمة في أي زوج وأي إطار زمني.
Bearish pennant
was formed on 04.04 at 16:10:48 (UTC+0)
signal strength 1 of 5
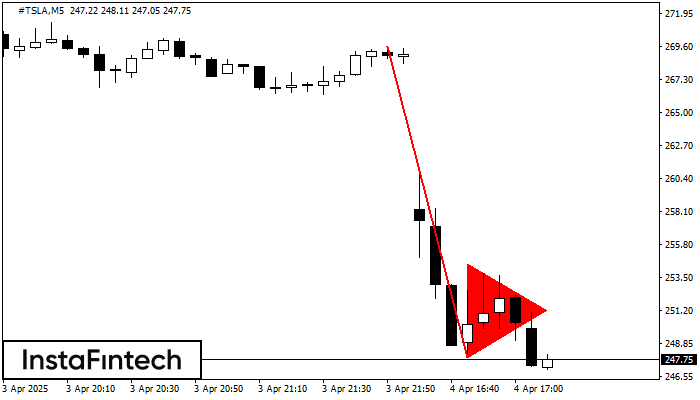
The Bearish pennant pattern has formed on the #TSLA M5 chart. It signals potential continuation of the existing trend. Specifications: the pattern’s bottom has the coordinate of 247.91; the projection of the flagpole height is equal to 2171 pips. In case the price breaks out the pattern’s bottom of 247.91, the downtrend is expected to continue for further level 247.76.
The M5 and M15 time frames may have more false entry points.
- All
- All
- Bearish Rectangle
- Bearish Symmetrical Triangle
- Bearish Symmetrical Triangle
- Bullish Rectangle
- Double Top
- Double Top
- Triple Bottom
- Triple Bottom
- Triple Top
- Triple Top
- All
- All
- Buy
- Sale
- All
- 1
- 2
- 3
- 4
- 5
Triple Bottom
was formed on 25.05 at 15:59:45 (UTC+0)
signal strength 4 of 5

The Triple Bottom pattern has formed on the chart of the #Bitcoin H1 trading instrument. The pattern signals a change in the trend from downwards to upwards in the case
Open chart in a new window
Double Bottom
was formed on 25.05 at 12:20:13 (UTC+0)
signal strength 1 of 5

The Double Bottom pattern has been formed on #Bitcoin M5. Characteristics: the support level 106888.42; the resistance level 107214.56; the width of the pattern 32614 points. If the resistance level
The M5 and M15 time frames may have more false entry points.
Open chart in a new window
Bullish Rectangle
was formed on 25.05 at 07:55:30 (UTC+0)
signal strength 1 of 5

According to the chart of M5, #Bitcoin formed the Bullish Rectangle which is a pattern of a trend continuation. The pattern is contained within the following borders: the lower border
The M5 and M15 time frames may have more false entry points.
Open chart in a new window


