

النماذج الفعلية

النماذج هي نماذج رسومية تتشكل في الرسم البياني حسب السعر. وفقا لأحد المسلمات التحليلية الفنية، فإن التاريخ (حركة السعر) يكرر نفسه. ويعني ذلك أن حركات الأسعار غالباً ما تكون متشابهة في نفس الأوضاع مما يجعل من الممكن التنبؤ بزيادة تطوير الوضع الذي يتسم باحتمال كبير.
النماذج ذات الصلة المقدمة من قبل إنستافوركس هي خدمة سهلة الاستخدام تسمح لك بمعرفة التغييرات الأخيرة في السوق والرد على الأدلة من السوق في الوقت المناسب. في خدمتنا، ستجد دائمًا النماذج الأكثر حداثة وملاءمة في أي زوج وأي إطار زمني.
Triple Top
was formed on 03.04 at 04:15:02 (UTC+0)
signal strength 1 of 5
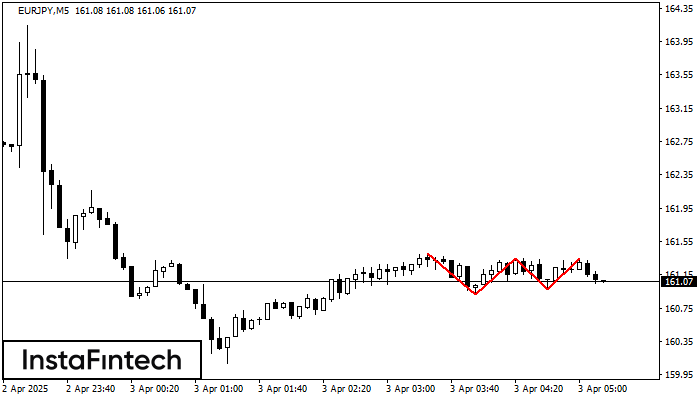
On the chart of the EURJPY M5 trading instrument, the Triple Top pattern that signals a trend change has formed. It is possible that after formation of the third peak, the price will try to break through the resistance level 160.92, where we advise to open a trading position for sale. Take profit is the projection of the pattern’s width, which is 49 points.
The M5 and M15 time frames may have more false entry points.
انظر أيضا
- All
- All
- Bearish Rectangle
- Bearish Symmetrical Triangle
- Bearish Symmetrical Triangle
- Bullish Rectangle
- Double Top
- Double Top
- Triple Bottom
- Triple Bottom
- Triple Top
- Triple Top
- All
- All
- Buy
- Sale
- All
- 1
- 2
- 3
- 4
- 5
Bearish Symmetrical Triangle
сформирован 23.05 в 04:35:13 (UTC+0)
сила сигнала 3 из 5
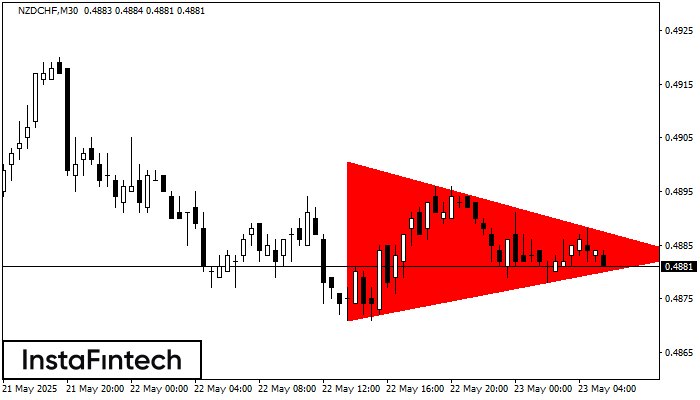
According to the chart of M30, NZDCHF formed the Bearish Symmetrical Triangle pattern. Trading recommendations: A breach of the lower border 0.4871 is likely to encourage a continuation
Открыть график инструмента в новом окне
Bearish Symmetrical Triangle
сформирован 23.05 в 04:34:52 (UTC+0)
сила сигнала 3 из 5
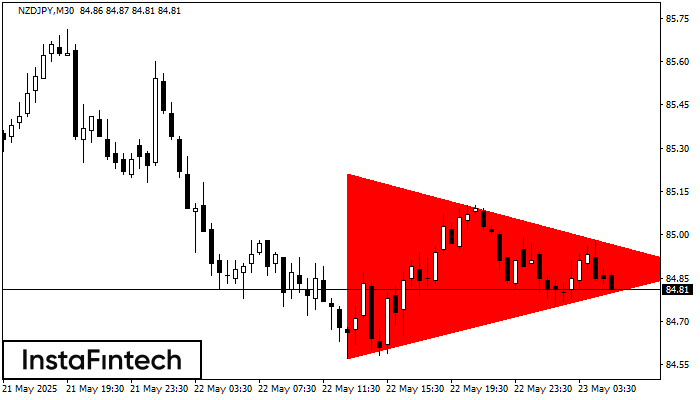
According to the chart of M30, NZDJPY formed the Bearish Symmetrical Triangle pattern. Trading recommendations: A breach of the lower border 84.57 is likely to encourage a continuation
Открыть график инструмента в новом окне
Double Top
сформирован 23.05 в 04:30:09 (UTC+0)
сила сигнала 2 из 5
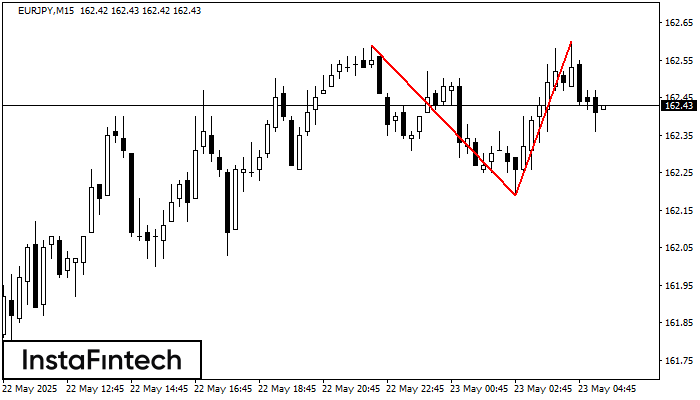
The Double Top reversal pattern has been formed on EURJPY M15. Characteristics: the upper boundary 162.59; the lower boundary 162.19; the width of the pattern is 41 points. Sell trades
The M5 and M15 time frames may have more false entry points.
Открыть график инструмента в новом окне


