

النماذج الفعلية

النماذج هي نماذج رسومية تتشكل في الرسم البياني حسب السعر. وفقا لأحد المسلمات التحليلية الفنية، فإن التاريخ (حركة السعر) يكرر نفسه. ويعني ذلك أن حركات الأسعار غالباً ما تكون متشابهة في نفس الأوضاع مما يجعل من الممكن التنبؤ بزيادة تطوير الوضع الذي يتسم باحتمال كبير.
النماذج ذات الصلة المقدمة من قبل إنستافوركس هي خدمة سهلة الاستخدام تسمح لك بمعرفة التغييرات الأخيرة في السوق والرد على الأدلة من السوق في الوقت المناسب. في خدمتنا، ستجد دائمًا النماذج الأكثر حداثة وملاءمة في أي زوج وأي إطار زمني.
Bearish Rectangle
was formed on 24.03 at 21:46:19 (UTC+0)
signal strength 2 of 5
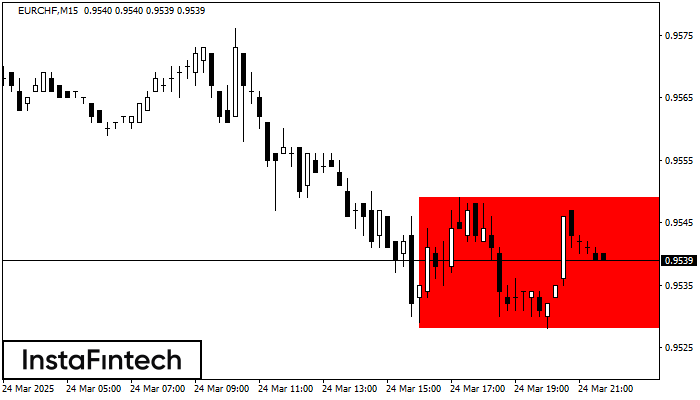
According to the chart of M15, EURCHF formed the Bearish Rectangle which is a pattern of a trend continuation. The pattern is contained within the following borders: lower border 0.9528 – 0.9528 and upper border 0.9549 – 0.9549. In case the lower border is broken, the instrument is likely to follow the downward trend.
The M5 and M15 time frames may have more false entry points.
- All
- All
- Bearish Rectangle
- Bearish Symmetrical Triangle
- Bearish Symmetrical Triangle
- Bullish Rectangle
- Double Top
- Double Top
- Triple Bottom
- Triple Bottom
- Triple Top
- Triple Top
- All
- All
- Buy
- Sale
- All
- 1
- 2
- 3
- 4
- 5
Прямоугольник
сформирован 08.05 в 07:42:13 (UTC+0)
сила сигнала 1 из 5
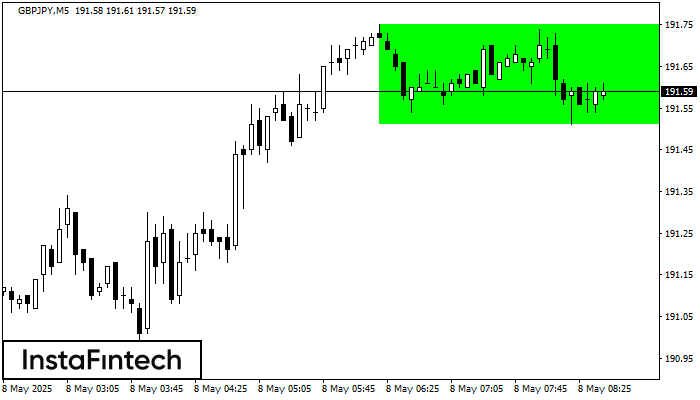
Сформирована фигура «Прямоугольник» на графике GBPJPY M5. Тип фигуры: Продолжение тренда; Границы: Верхняя 191.75, Нижняя 191.51; Сигнал: позицию на покупку следует открывать выше верхней границы прямоугольника 191.75
Таймфреймы М5 и М15 могут иметь больше ложных точек входа.
Открыть график инструмента в новом окне
Тройная вершина
сформирован 08.05 в 07:30:25 (UTC+0)
сила сигнала 2 из 5
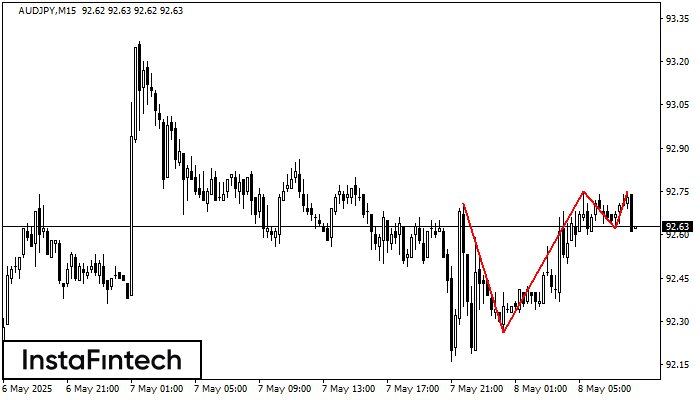
По AUDJPY на M15 сформировалась фигура «Тройная вершина». Характеристика: Границы имеют восходящий угол. Нижняя граница фигуры имеет координаты 92.26/92.62, при этом верхняя граница 92.71/92.75. Проекция ширины 45 пунктов. Формирование фигуры
Таймфреймы М5 и М15 могут иметь больше ложных точек входа.
Открыть график инструмента в новом окне
Тройная вершина
сформирован 08.05 в 07:15:11 (UTC+0)
сила сигнала 1 из 5
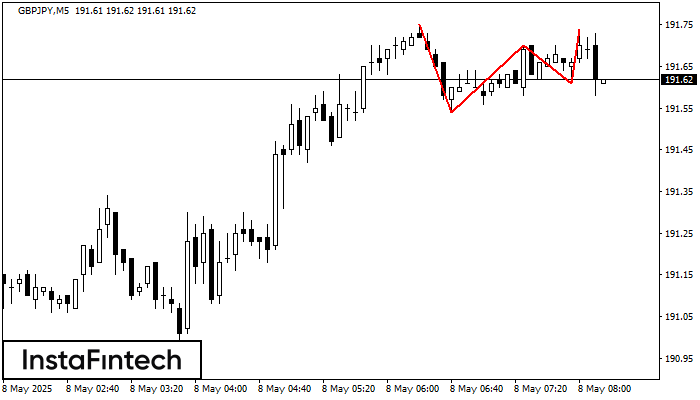
На графике GBPJPY M5 образовалась фигура «Тройная вершина». Данная фигура относится к типу разворотных и имеет характеристику: Верхняя граница 191.75/191.74; Нижняя граница 191.54/191.61; Ширина фигуры 9 пунктов. Прогноз: В случае
Таймфреймы М5 и М15 могут иметь больше ложных точек входа.
Открыть график инструмента в новом окне


